Visualize a network with custom layouts
Usage
ggNetView(
  graph_obj,
  layout = NULL,
  node_add = 7,
  ring_n = NULL,
  r = 1,
  center = TRUE,
  idx = NULL,
  shrink = 1,
  k_nn = 12,
  push_others_delta = 0,
  layout.module = c("random", "adjacent", "order"),
  shape = 21,
  pointalpha = 1,
  pointsize = c(1, 10),
  pointstroke = 0.3,
  pointlabel = NULL,
  pointlabelsize = 5,
  group.by = "Modularity",
  fill.by = "Modularity",
  color.by = NULL,
  fill = NULL,
  color = NULL,
  jitter = FALSE,
  jitter_sd = 0.1,
  plot_line = TRUE,
  mapping_line = FALSE,
  curve = F,
  curvature = 0.25,
  linealpha = 0.25,
  linecolor = "grey70",
  label = FALSE,
  labelsize = 10,
  labelsegmentsize = 1,
  labelsegmentalpha = 1,
  add_group_outer = FALSE,
  add_group_outer_expand = 2,
  add_group_outer_color = "grey50",
  add_group_outer_fill = NULL,
  add_group_outer_fill_alpha = 0.2,
  add_group_outer_linetype = 1,
  add_group_outer_linewidth = 0.5,
  add_outer = FALSE,
  q_outer = 0.88,
  expand_outer = 1.02,
  outerwidth = 1.25,
  outerlinetype = 2,
  outeralpha = 0.5,
  nodelabsize = 5,
  remove = FALSE,
  dropOthers = FALSE,
  orientation = "up",
  angle = 0,
  scale = T,
  anchor_dist = 6,
  nrow = NULL,
  ncol = NULL,
  seed = 1115,
  scale_radius = NULL,
  return_layout = FALSE
)
Arguments
- graph_obj
An graph object from build_graph_from_mat or build_graph_from_df. The network object to be visualized.
- layout
Character string. Custom layouts; one of "gephi", "square", "square2", "petal", "petal2", "heart_centered","diamond", "star", "star_concentric","rectangle, "rightiso_layers" etc.
- node_add
Integer (default = 7). Number of nodes to add in each layer of the layout.
- ring_n
Numeric (default = 7) Numbers of ring in rings layout.
- r
Numeric (default = 1). Radius increment for concentric or layered layouts.
- center
Logical (default = TRUE). Whether to place a node at the center of the layout.
- idx
Optional. Index of nodes to be emphasized or centered in the layout
- shrink
Numeric (default = 1). Shrinkage factor applied to the center points.
- k_nn
Numeric (default = 8). Number of nearest neighbors used to build the local adjacency graph.
- push_others_delta
Numeric (default = 0). Radial offset applied to the "Others" module to slightly
- layout.module
Character (default = "random") - random : modules are distributed more randomly and independently. - adjacent : modules are positioned close to each other, minimizing inter-module gaps. - order : modules are distributed by order, applicable to `Bipartite, Tripartite, Quadripartite, Multipartite, Pentapartite Layout`
- shape
Integer (default = 21). The point shape likely in ggplot2. If a character string is provided, it must be a variable name in graph_object for point shape mapping.
- pointalpha
Integer (default = 1). The point alpha
- pointsize
Vector (default = c(1,10)) The point size rang.
- pointstroke
Integer (default = 0.3).
- pointlabel
Character (default = NULL). Optional node label mode for top Degree nodes within each module. Supported values:
"topN"(e.g."top1","top7","top20") and"ALL".- pointlabelsize
Integer (default = 5). Change point label size.
- group.by
Character (default = "Modularity"). Change group for nodes
- fill.by
Character (default = "Modularity"). Change fill for nodes
- color.by
Character (default = NULL). Change color for nodes. If provided, must be a variable name in graph_object. Numeric uses
scale_color_gradient, otherwise usesscale_color_manualorscale_color_ggnetview.- fill
Named vector of colors for node fill (e.g.
c("M1" = "red", "M2" = "blue")). IfNULL(default), usesscale_fill_ggnetview; if provided, usesscale_fill_manual(values = fill).- color
Named vector of colors for node/edge/label color. If
NULL(default), usesscale_color_ggnetview; if provided, usesscale_color_manual(values = color).- jitter
Logical (default = FALSE). Whether to apply jitter to points.
- jitter_sd
Integer (default = 0.1). The standard deviation of the jitter applied when `jitter = TRUE`.
- plot_line
Logical (default = TRUE). Whether to plot line in net plot.
- mapping_line
Logical (default = FALSE). Whether to mapping line in ggNetView. If a character string is provided, it must be a variable name in graph_object for line color mapping.
- curve
Logical (default = FALSE). Whether to plot curve line in net plot.
- curvature
Integer (default = 0.25) The curve level of curve line when curve is TRUE
- linealpha
Integer (default = 0.25). Change line alpha.
- linecolor
Character (default = "grey70"). Change line color.
- label
Logical or Character (default =
FALSE). Controls module label text and module legend prefix. IfFALSE, module text labels are not drawn and legend prefix uses"Modularity". IfTRUE, module text labels are drawn and legend prefix uses"Modularity". If a character string, module text labels are drawn and that string is used as prefix for module text and module legend labels.- labelsize
Integer (default = 10). Change Module label size.
- labelsegmentsize
Integer (default = 1). Change label segment size.
- labelsegmentalpha
Integer (default = 1). Change label segment alpha.
- add_group_outer
Logical (default = FALSE). Whether to add a circle boundary around the entire network (mimics
ggforce::geom_mark_circle).- add_group_outer_expand
Numeric (default = 2). Expansion in mm for the group circle to account for point size; passed to
geom_mark_circle(expand = ...).- add_group_outer_color
Character (default = "grey50"). Color of the group outer circle border.
- add_group_outer_fill
Character or NULL (default = NULL). Fill color of the group outer circle.
NULL= no fill (transparent).- add_group_outer_fill_alpha
Numeric (default = 0.2). Alpha (transparency) of the group outer circle fill; 0 = fully transparent, 1 = opaque.
- add_group_outer_linetype
Integer or character (default = 1). Linetype of the group outer circle (e.g. 1 = solid, 2 = dashed).
- add_group_outer_linewidth
Numeric (default = 0.5). Line width of the group outer circle.
- add_outer
Logical (default = FALSE). Whether to add an outer circle/border around each module.
- q_outer
Numeric (default = 0.88). Quantile of radial distance used to construct the smooth outer boundary for each module. Higher values make the boundary more expanded; lower values make it tighter.
- expand_outer
Numeric (default = 1.02). Global scaling factor applied to the smoothed radial distances when drawing the outer boundary. Values > 1 slightly expand the boundary; values < 1 slightly shrink it.
- outerwidth
Integer (default = 1.25). Change outer linewidth.
- outerlinetype
Integer (default = 2). Change outer linetype.
- outeralpha
Integer (default = 0.5). Change outer alpha.
- nodelabsize
Integer (default = 5). Change node label size.
- remove
Logical (default = FALSE). Remove
"Others"only at the visualization stage (post-layout), so the layout of remaining modules is kept unchanged.- dropOthers
Logical (default = FALSE). If TRUE, remove nodes in the
"Others"module fromgraph_objbefore layout and visualization, then recompute layout/plot from the updated graph.- orientation
Character string. Custom orientation; one of "up","down","left","right".
- angle
Integer (default = 0). Change orientation angle.
- scale
Logical (default = T). modules applicable to `Bipartite, Tripartite, Quadripartite, Multipartite, Pentapartite Layout` to scale the radius
- anchor_dist
Integer (default = 6) the distance of each modules, applicable to `Bipartite, Tripartite, Quadripartite, Multipartite, Pentapartite Layout`
- nrow
Integer (default = NULL). the nrow of network with layout is "consensus_module_equal_gephi" or "consensus_module_gephi"
- ncol
Integer (default = NULL). the ncol of network with layout is "consensus_module_equal_gephi" or "consensus_module_gephi"
- seed
Integer (default = 1115). Random seed for reproducibility.
- scale_radius
Numeric or NULL (default = NULL). When non-NULL, scale the layout so the network fits within this radius. Used by
ggnetview_modularity_heatmapsfor coordinate alignment.- return_layout
Logical (default = FALSE). When TRUE, return a list with
$plot(ggplot) and$layout_data(graph_ly_final, graph_obj, ggplot_data, module_centroids) for downstream use (e.g. adding heatmaps and links).
Examples
data(ppi_example)
obj <- build_graph_from_df(
df = ppi_example$ppi,
node_annotation = ppi_example$annotation,
module.method = "Fast_greedy",
top_modules = 5
)
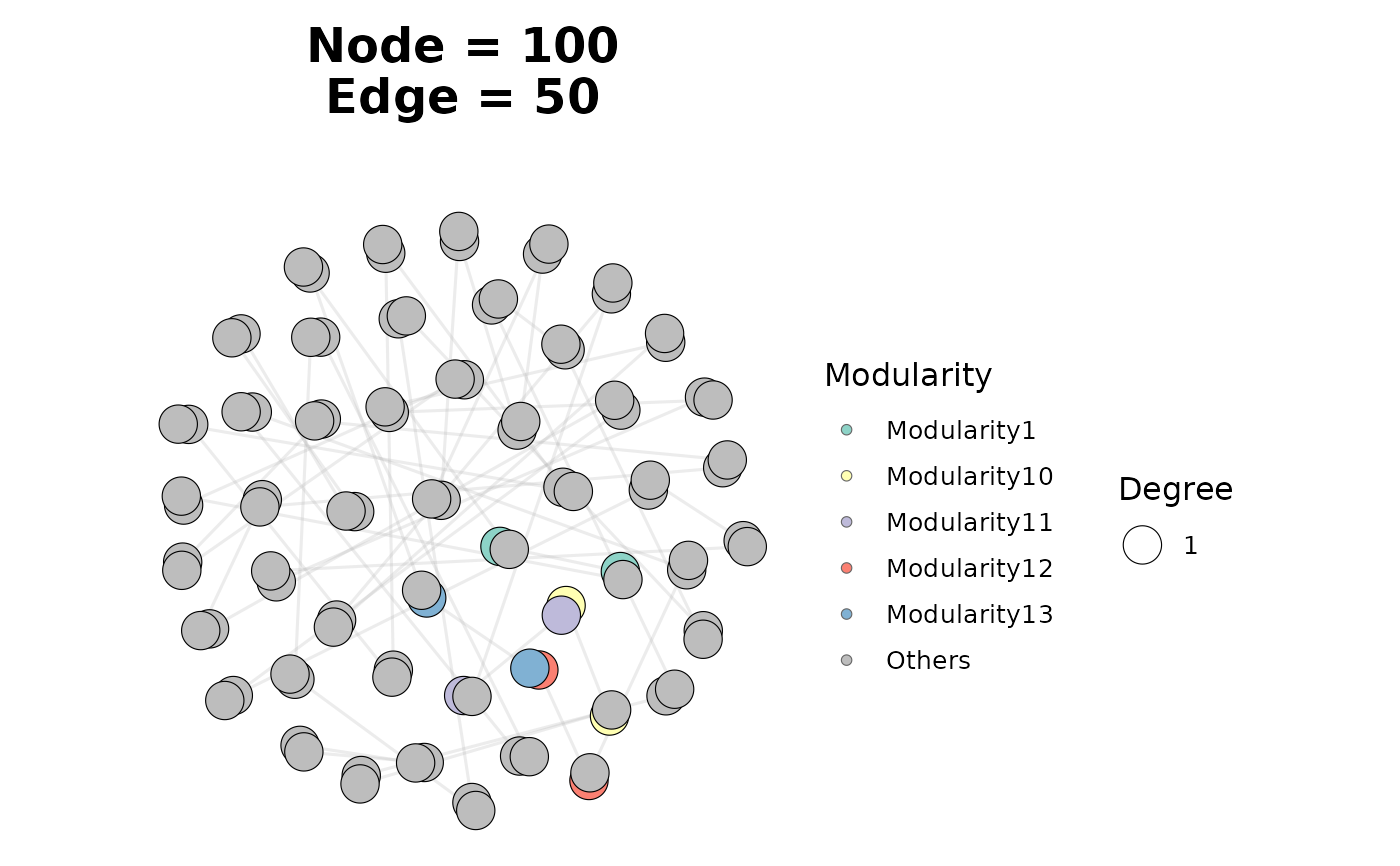
ggNetView(
graph_obj = obj,
layout = "fr",
layout.module = "adjacent",
pointsize = c(3, 8),
seed = 1115
)
 # \donttest{
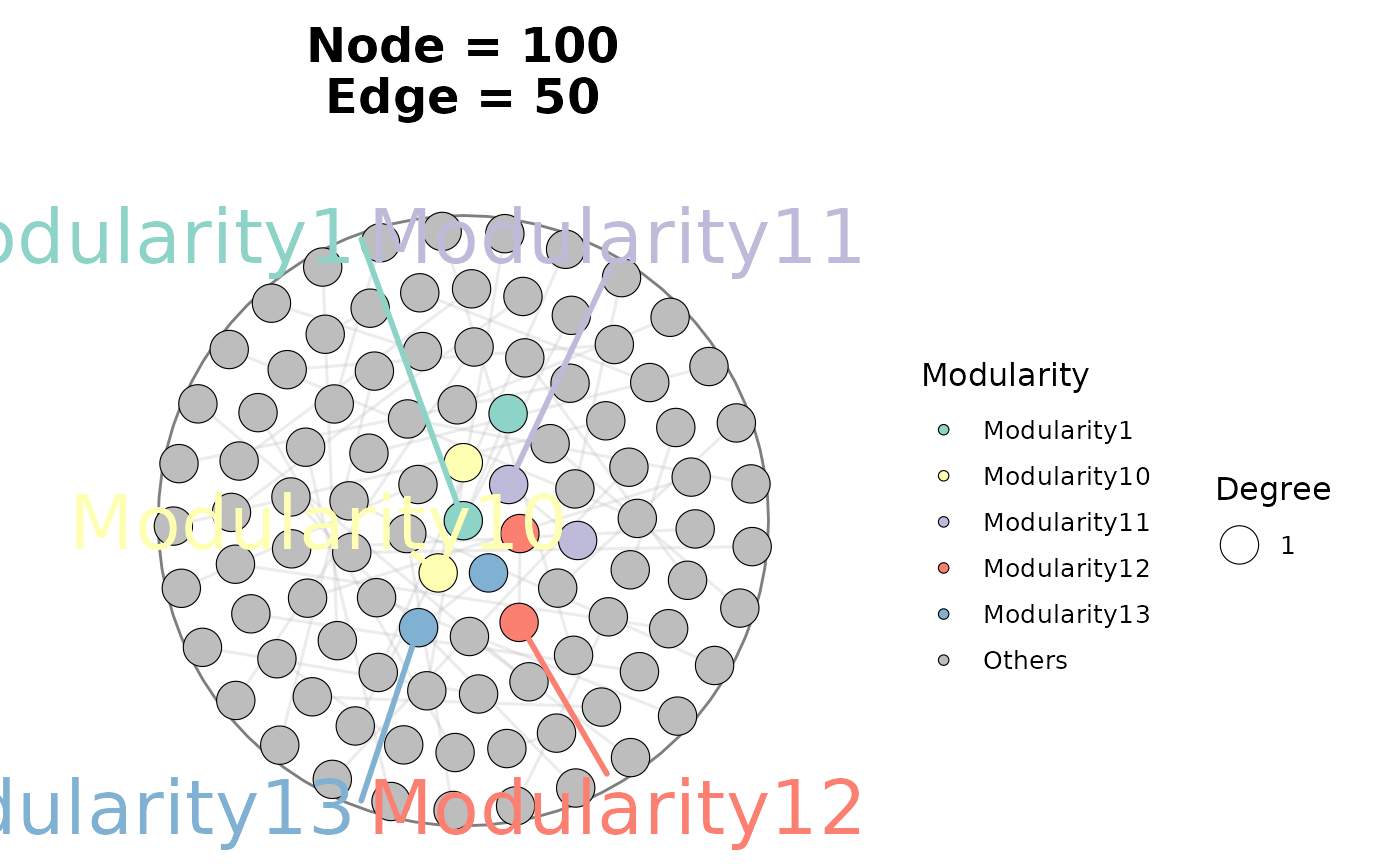
ggNetView(
graph_obj = obj,
layout = "gephi",
layout.module = "adjacent",
pointsize = c(3, 8),
label = TRUE,
add_group_outer = TRUE,
seed = 1115
)
#> Coordinate system already present.
#> ℹ Adding new coordinate system, which will replace the existing one.
#> Warning: No shared levels found between `names(values)` of the manual scale and the
#> data's fill values.
# \donttest{
ggNetView(
graph_obj = obj,
layout = "gephi",
layout.module = "adjacent",
pointsize = c(3, 8),
label = TRUE,
add_group_outer = TRUE,
seed = 1115
)
#> Coordinate system already present.
#> ℹ Adding new coordinate system, which will replace the existing one.
#> Warning: No shared levels found between `names(values)` of the manual scale and the
#> data's fill values.
 # }
# }