9 Multi-Network and comparison
Load R Package
library(tidyverse)   # data manipulation / piping utilities
library(ggNetView)   # graph builders + info-extraction helpers
Example data
# Access built-in example datasets in ggNetView

# ---- Dataset 1: Relative abundance table of rarefied ASVs/OTUs ----
# Rows = ASVs/OTUs (features / variables), Columns = samples
data("otu_rare_relative")
dim(otu_rare_relative)  # Check matrix dimensions: n_features x n_samples
## [1] 2859 18
otu_rare_relative[1:5, 1:5] # Preview first 5 rows x 5 cols to confirm data layout## KO1 KO2 KO3 KO4 KO5
## ASV_1 0.03306667 0.05453333 0.02013333 0.03613333 0.02686667
## ASV_2 0.05750000 0.03393333 0.06046667 0.05810000 0.07320000
## ASV_3 0.01733333 0.01296667 0.02290000 0.02336667 0.03106667
## ASV_4 0.04266667 0.01093333 0.01416667 0.01933333 0.03346667
## ASV_6 0.02646667 0.01856667 0.02110000 0.02353333 0.03806667
# ---- Dataset 2: Taxonomic annotation table for ASVs/OTUs ----
# Rows = ASVs/OTUs (row names should match the abundance table above)
# Columns = taxonomic ranks (Kingdom ~ Species, etc.)
data("tax_tab")
dim(tax_tab)
## [1] 2859 8
tax_tab[1:5, 1:5]## # A tibble: 5 × 5
## OTUID Kingdom Phylum Class Order
## <chr> <chr> <chr> <chr> <chr>
## 1 ASV_2 Archaea Thaumarchaeota Unassigned Nitrososphaerales
## 2 ASV_3 Bacteria Verrucomicrobia Spartobacteria Unassigned
## 3 ASV_31 Bacteria Actinobacteria Actinobacteria Actinomycetales
## 4 ASV_27 Archaea Thaumarchaeota Unassigned Nitrososphaerales
## 5 ASV_9 Bacteria Unassigned Unassigned Unassigned
# ---- Dataset 3: Sample metadata ----
# Rows = samples (sample IDs should match colnames of `otu_rare_relative`)
# Columns = experimental grouping variables (e.g. treatment, time point, site)
data("otu_sample")
otu_sample                    # print the full sample-info table (small enough to view directly)
## Sample Group
## 1 KO1 KO
## 2 KO2 KO
## 3 KO3 KO
## 4 KO4 KO
## 5 KO5 KO
## 6 KO6 KO
## 7 OE1 OE
## 8 OE2 OE
## 9 OE3 OE
## 10 OE4 OE
## 11 OE5 OE
## 12 OE6 OE
## 13 WT1 WT
## 14 WT2 WT
## 15 WT3 WT
## 16 WT4 WT
## 17 WT5 WT
## 18 WT6 WT9.1 Comparison of multi-sample networks
9.1.1 layout = “gephi”, scale = FALSE
# ---- Multi-network "linked" view (no per-group scale normalisation) ----
# `ggNetView_multi_link()` builds ONE network per group (defined by `group_info`),
# lays each one out independently, and places all sub-networks on a circular
# anchor frame so that cross-group edges/relationships can be visually compared.
out1 <- ggNetView_multi_link(
  mat              = otu_rare_relative, # variables x samples abundance matrix
  group_info       = otu_sample,        # sample metadata; defines how samples are split into groups
  transfrom.method = "none",            # pre-correlation transform on `mat`; "none" = keep as-is
  r.threshold      = 0.7,               # |r| cutoff for keeping an edge
  p.threshold      = 0.05,              # adjusted p-value cutoff
  method           = "WGCNA",           # correlation backend: WGCNA::corAndPvalue
  cor.method       = "pearson",         # Pearson correlation
  proc             = "BH",              # multiple-testing correction (Benjamini-Hochberg)
  module.method    = "Fast_greedy",     # community detection per sub-network
  layout.module    = "adjacent",        # neighbouring modules placed close together
  center           = T,                 # pull a node toward the centre of each sub-layout
  top_modules      = 15,                # keep top-15 modules per sub-network; rest -> "Others"
  layout           = "gephi",           # global node-positioning algorithm per sub-network
  shrink           = 0.5,               # shrink each sub-network inward (smaller = more compact)
  scale            = F,                 # do NOT normalise each group to a common scale -> sub-networks keep their native size differences
  jitter           = T,                 # jitter node positions slightly to reduce overlap
  jitter_sd        = 0.3,               # SD of the jitter (bigger -> more spread)
  anchor_dist      = 30,                 # distance between groups on the outer anchor circle
  seed             = 1115,              # fix RNG for reproducibility
  orientation      = "up",              # frame orientation; one of "up"/"down"/"left"/"right"
  angle            = 0                  # additional rotation angle (degrees)
)
## Scale for size is already present.
## Adding another scale for size, which will replace the existing scale.
## Scale for size is already present.
## Adding another scale for size, which will replace the existing scale.
p1 <- out1[["p"]] # the assembled ggplot object
p1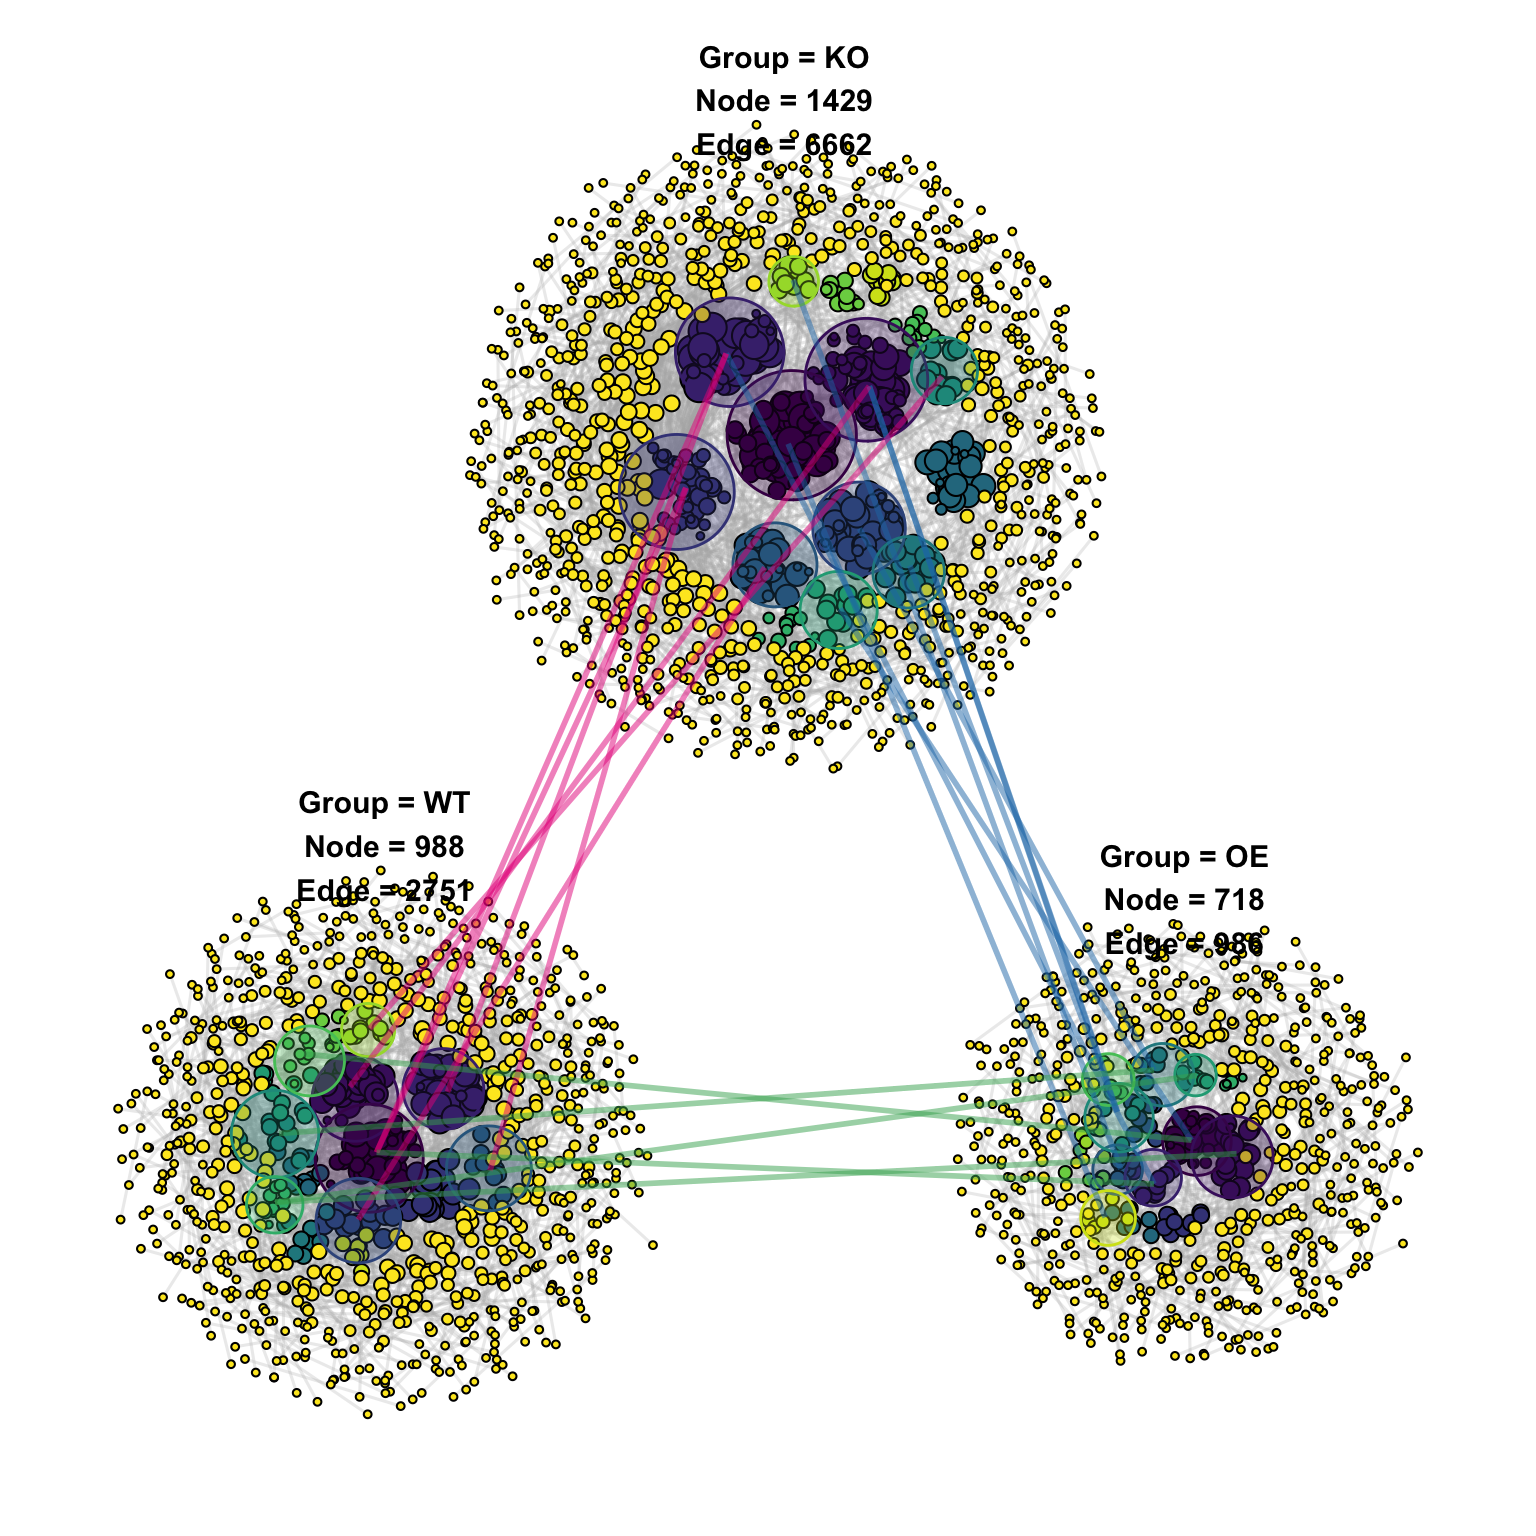
out1$info # auxiliary table: per-group node/edge counts, module info, etc.## # A tibble: 22 × 11
## modA modB overlap sizeA sizeB overlap_coef pvalue FDR Group GroupA
## <chr> <chr> <int> <int> <int> <dbl> <dbl> <dbl> <chr> <chr>
## 1 15 1 2 6 14 0.333 0.0140 0.776 KO_to_OE KO
## 2 16 3 2 19 8 0.25 0.0450 1 KO_to_OE KO
## 3 52 6 1 4 3 0.333 0.0280 0.895 KO_to_OE KO
## 4 4 8 2 16 6 0.333 0.0182 0.776 KO_to_OE KO
## 5 3 9 2 22 3 0.667 0.00741 0.633 KO_to_OE KO
## 6 7 9 1 4 3 0.333 0.0280 0.895 KO_to_OE KO
## 7 3 12 2 22 3 0.667 0.00741 0.633 KO_to_OE KO
## 8 1 15 2 32 3 0.667 0.0157 0.776 KO_to_OE KO
## 9 Others Others 224 263 342 0.852 0.00109 0.279 KO_to_OE KO
## 10 16 1 4 29 28 0.143 0.0415 1 KO_to_WT KO
## # ℹ 12 more rows
## # ℹ 1 more variable: GroupB <chr>9.1.2 layout = “gephi”, scale = TRUE
####----Plot2----####
# ---- Same setup but with `scale = TRUE` -> each group normalised to a common size ----
# Useful when groups have very different network sizes and you want them
# visually comparable side-by-side. With `scale = TRUE` the native size
# differences are removed, so jitter_sd is also reduced (0.01) accordingly.
out2 <- ggNetView_multi_link(
mat = otu_rare_relative,
group_info = otu_sample,
transfrom.method = "none",
r.threshold = 0.7,
p.threshold = 0.05,
method = "WGCNA",
cor.method = "pearson",
proc = "BH",
module.method = "Fast_greedy",
layout.module = "adjacent",
center = T,
top_modules = 15,
layout = "gephi",
shrink = 0.5,
scale = T, # normalise each group to a comparable coordinate scale
jitter = T,
jitter_sd = 0.01, # smaller jitter — sub-networks are already on a unified scale
anchor_dist = 1,
seed = 1115,
orientation = "up",
angle = 0
)## Scale for size is already present.
## Adding another scale for size, which will replace the existing scale.
## Scale for size is already present.
## Adding another scale for size, which will replace the existing scale.
p2 <- out2[["p"]]
p2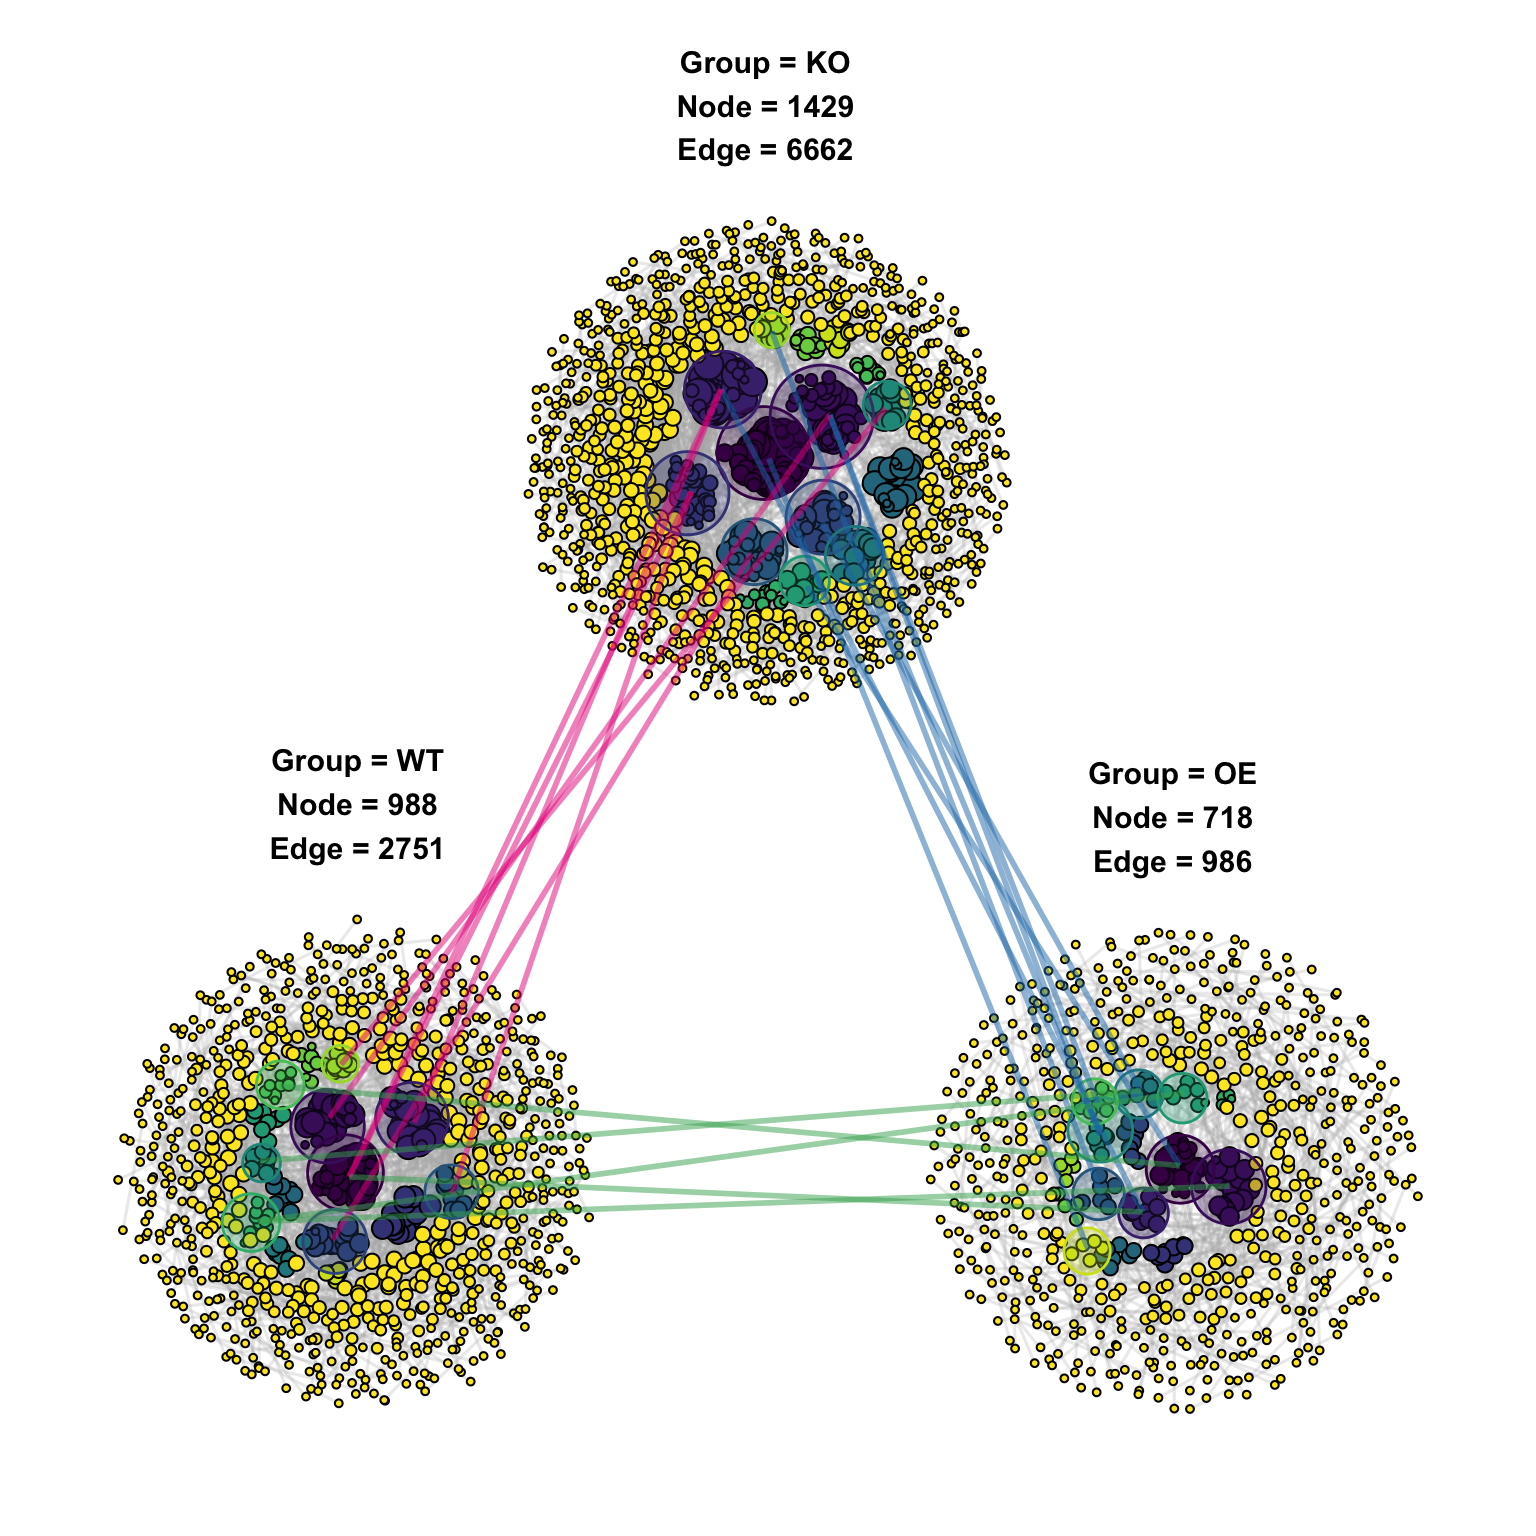
add_group_outer = TRUE
####----Plot2----####
# ---- Same setup but with `scale = TRUE` -> each group normalised to a common size ----
# Useful when groups have very different network sizes and you want them
# visually comparable side-by-side. With `scale = TRUE` the native size
# differences are removed, so jitter_sd is also reduced (0.01) accordingly.
out3 <- ggNetView_multi_link(
mat = otu_rare_relative,
group_info = otu_sample,
transfrom.method = "none",
r.threshold = 0.7,
p.threshold = 0.05,
method = "WGCNA",
cor.method = "pearson",
proc = "BH",
module.method = "Fast_greedy",
layout.module = "adjacent",
center = T,
top_modules = 15,
layout = "gephi",
shrink = 0.5,
scale = T, # normalise each group to a comparable coordinate scale
jitter = T,
jitter_sd = 0.01, # smaller jitter — sub-networks are already on a unified scale
anchor_dist = 1,
seed = 1115,
orientation = "up",
angle = 0,
add_group_outer = T
)## Scale for size is already present.
## Adding another scale for size, which will replace the existing scale.
## Scale for size is already present.
## Adding another scale for size, which will replace the existing scale.
p3 <- out3[["p"]]
p3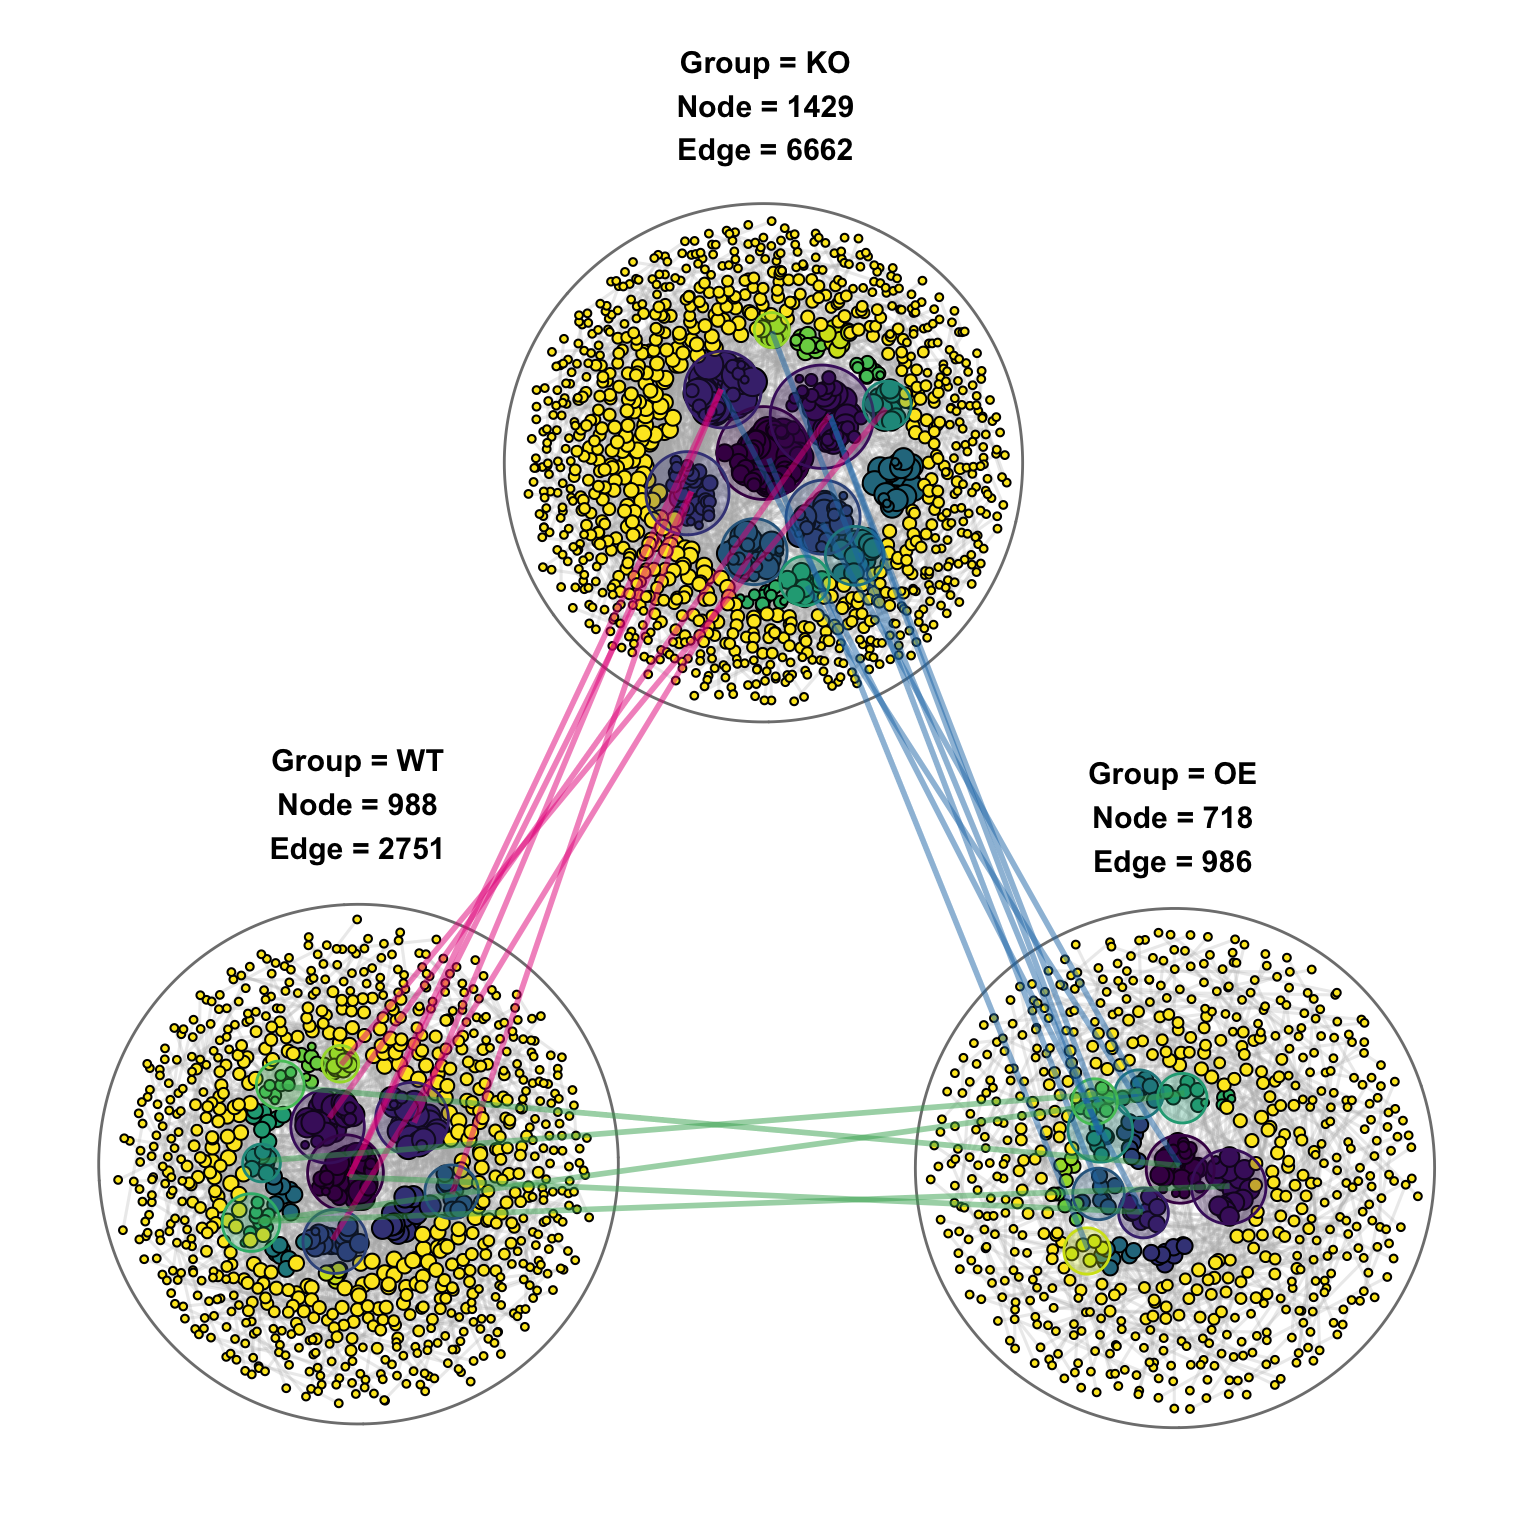
9.1.3 layout = “circular_modules_equal_gephi_layout”
# ---- Circular-modules layout: nodes within each module on equal arcs ----
# Better than "gephi" when you want module structure to dominate the picture.
# `link_level = "Node"`: cross-group links are drawn between individual NODES.
out_multi_link <- ggNetView_multi_link(
mat = otu_rare_relative,
group_info = otu_sample,
transfrom.method = "none",
r.threshold = 0.7,
p.threshold = 0.05,
method = "WGCNA",
cor.method = "pearson",
proc = "BH",
module.method = "Fast_greedy",
layout = "circular_modules_equal_gephi_layout", # per-sub-network layout
layout.module = "order", # modules placed in a fixed order (not random/adjacent)
top_modules = 15,
scale_groups = T, # normalise each group to a comparable scale
add_outer = "circle", # outer frame style; "circle" / "manual" / etc.
r = 5, # radius of each per-group sub-network
jitter = F, # don't jitter nodes
anchor_dist = 1, # distance between groups on the anchor frame
layout_anchor_dist = 150, # anchor frame size in the per-sub-network layout
seed = 1115,
dropOthers = T, # drop the "Others" module before plotting
link_level = "Node" # connect cross-group items at NODE level
)## Scale for size is already present.
## Adding another scale for size, which will replace the existing scale.
## Scale for size is already present.
## Adding another scale for size, which will replace the existing scale.
p_multi_link <- out_multi_link[["p"]]
p_multi_link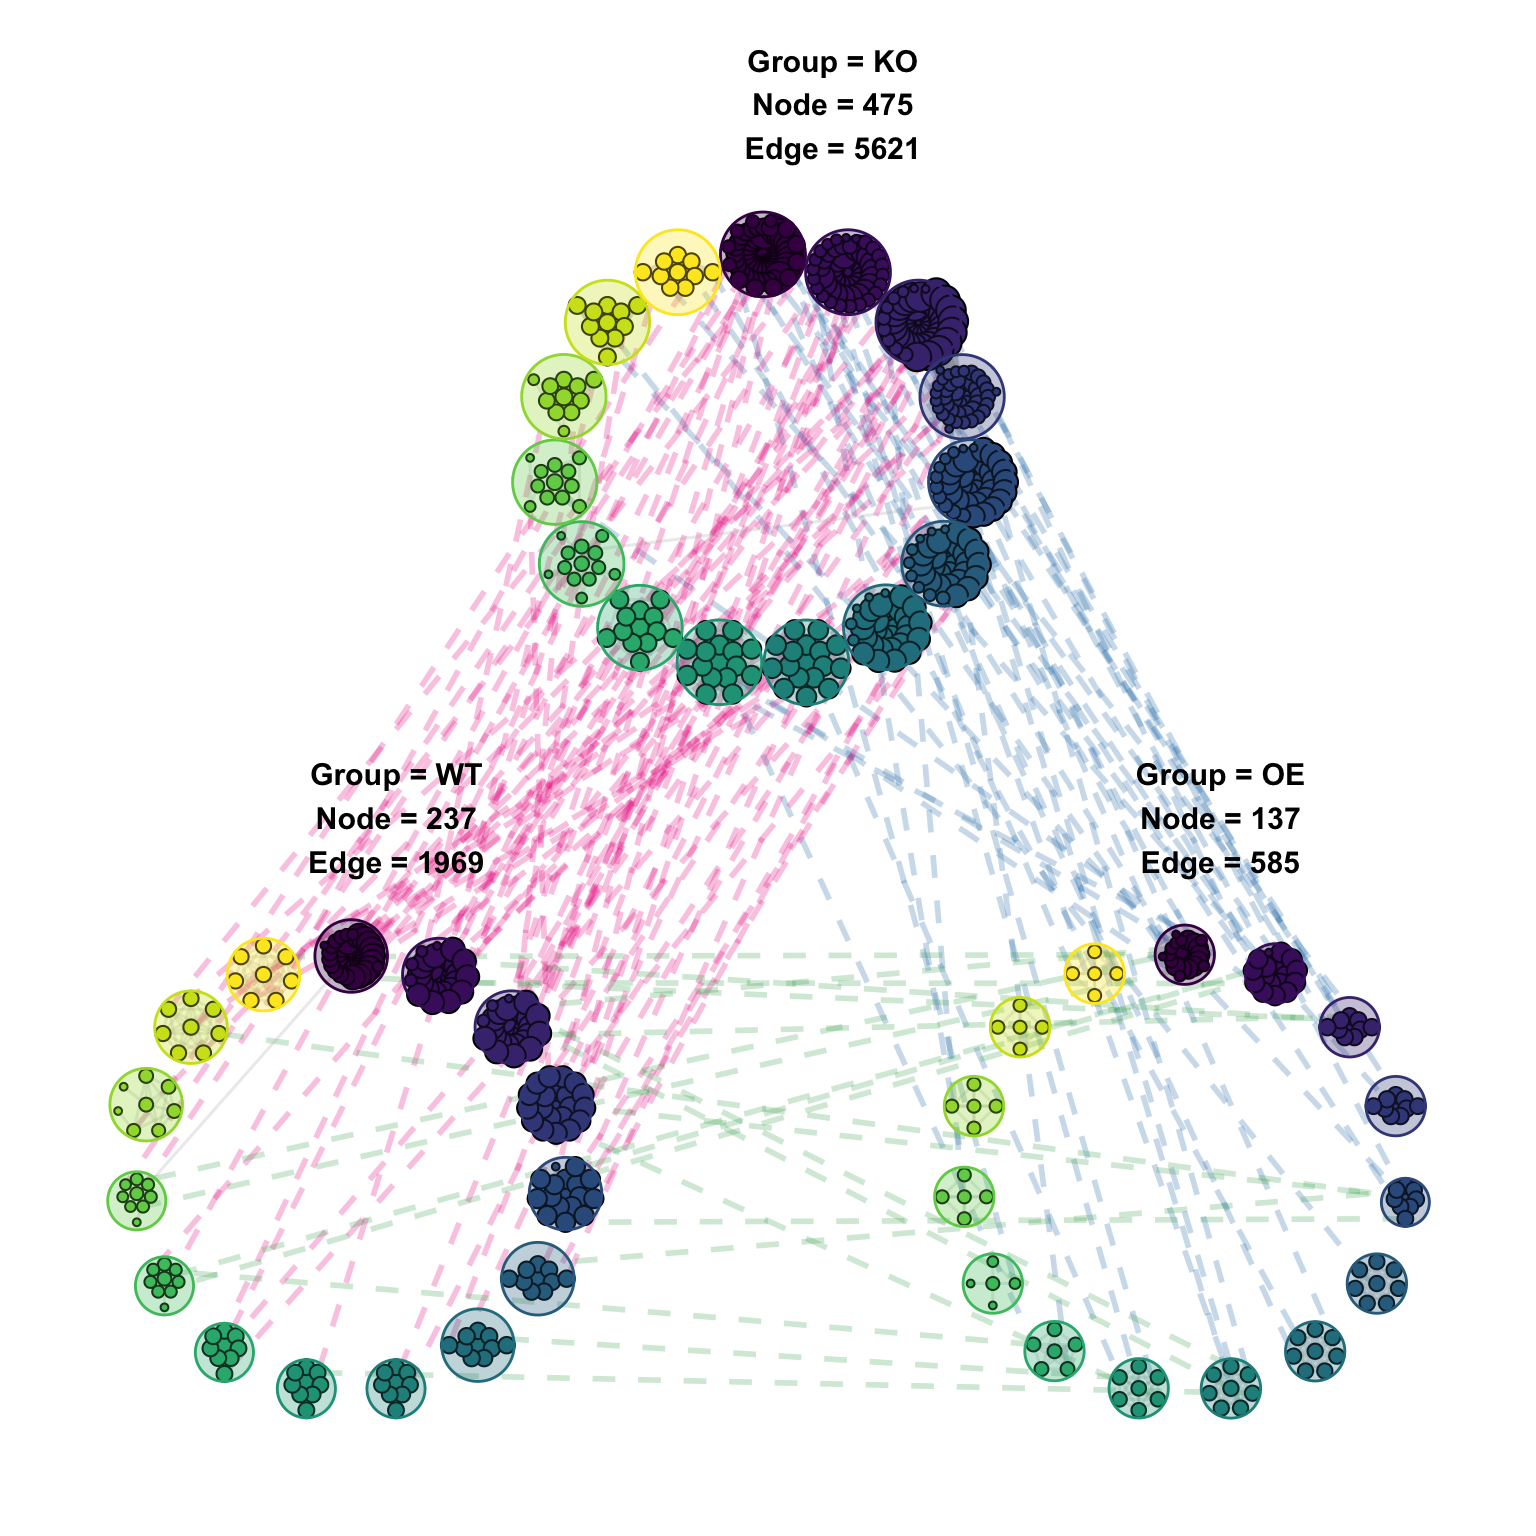
9.1.4 layout = “circular_modules_equal_gephi_layout”
link_level = “Node”
# ---- Duplicate of the previous chunk (kept here for reference) ----
out_multi_link <- ggNetView_multi_link(
mat = otu_rare_relative,
group_info = otu_sample,
transfrom.method = "none",
r.threshold = 0.7,
p.threshold = 0.05,
method = "WGCNA",
cor.method = "pearson",
proc = "BH",
module.method = "Fast_greedy",
layout = "circular_modules_equal_gephi_layout",
layout.module = "order",
top_modules = 15,
scale_groups = T,
add_outer = "circle",
r = 5,
jitter = F,
anchor_dist = 1,
layout_anchor_dist = 150,
seed = 1115,
dropOthers = T,
link_level = "Node"
)## Scale for size is already present.
## Adding another scale for size, which will replace the existing scale.
## Scale for size is already present.
## Adding another scale for size, which will replace the existing scale.
p_multi_link <- out_multi_link[["p"]]
p_multi_link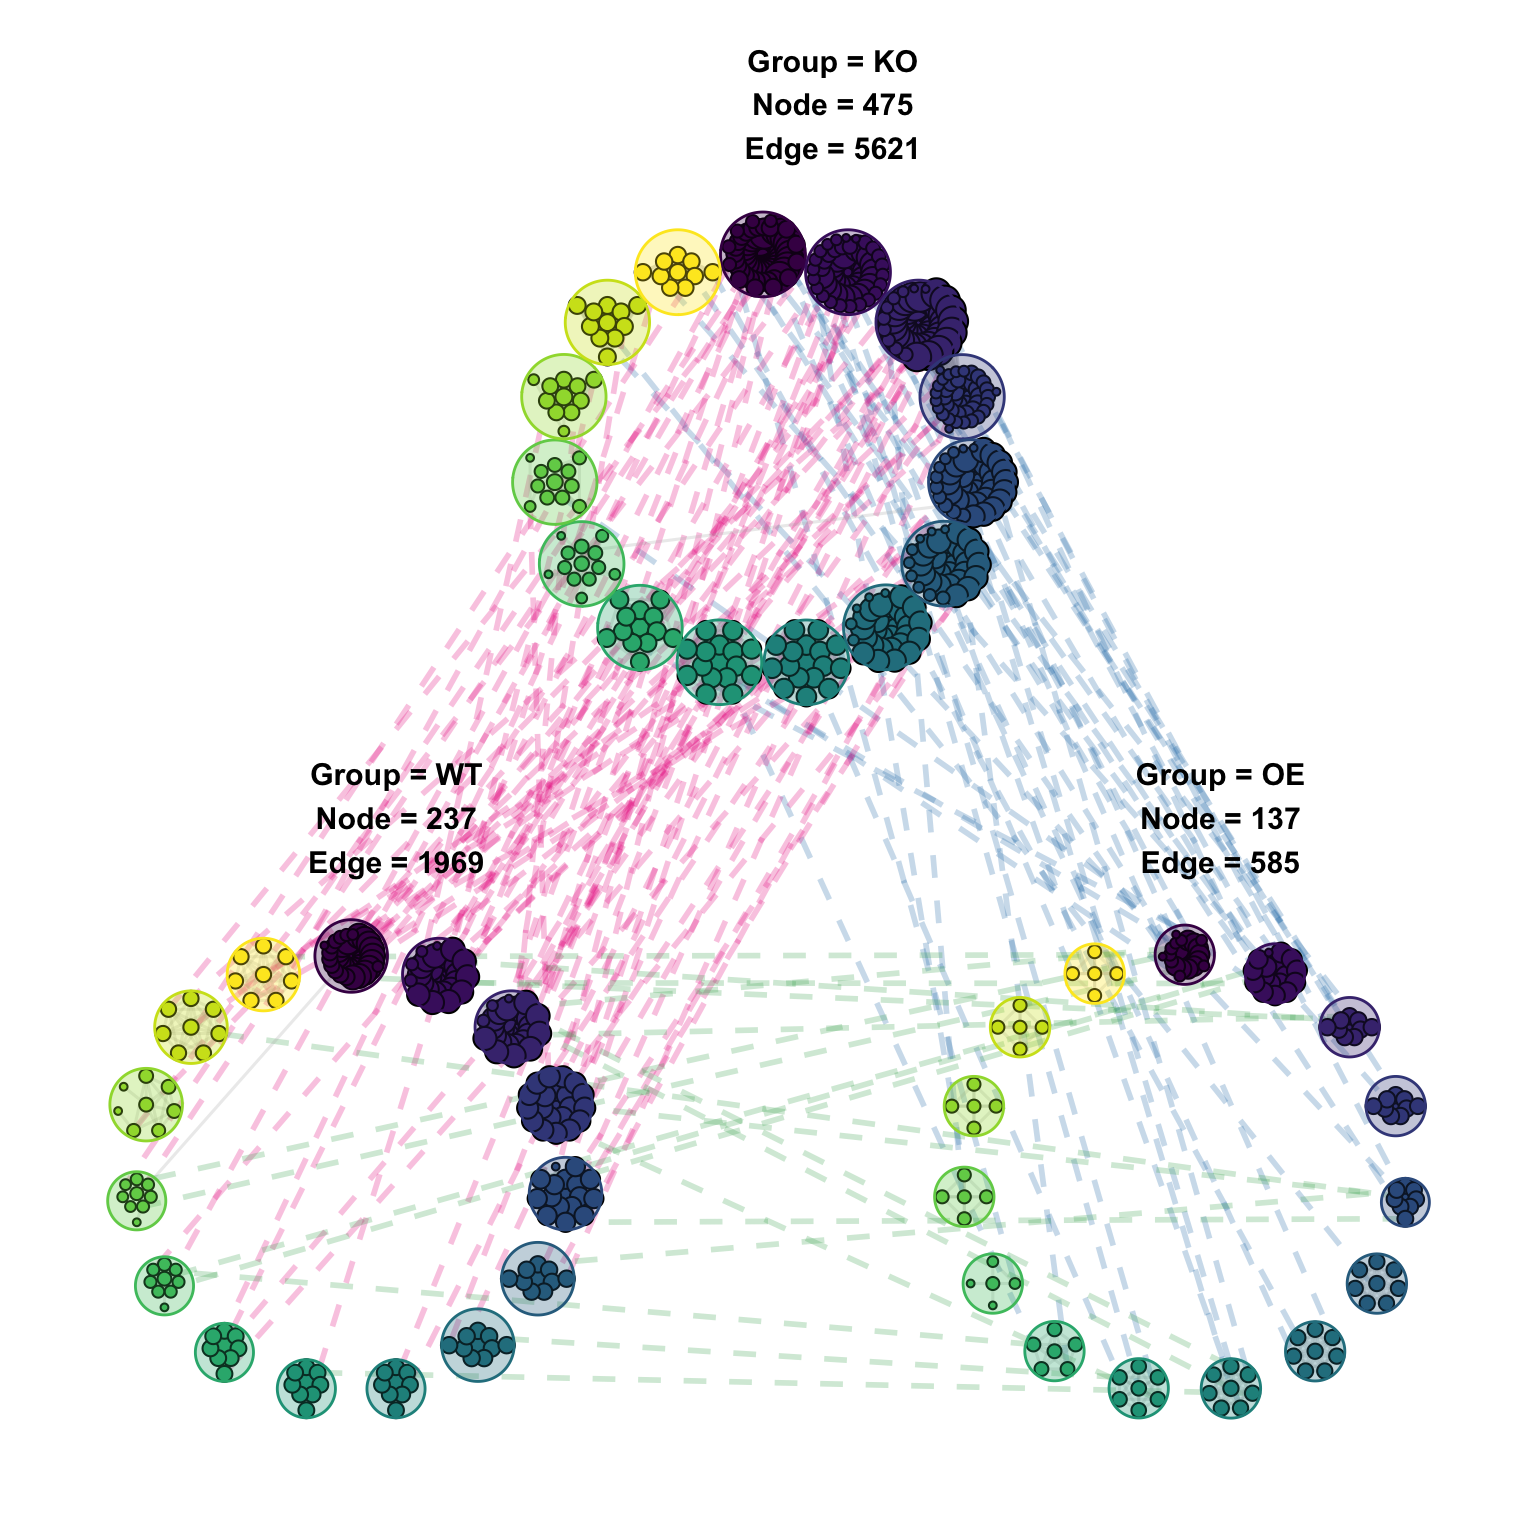
9.1.5 layout = “circular_modules_equal_gephi_layout”
link_level = “Module&Node2”
# ---- Cross-group links at "Module & Node2" level ----
# Instead of drawing one line per shared node, draw bundled links between
# modules AND between the corresponding nodes — useful when there are many
# shared items and per-node links become visually cluttered.
out_multi_link2 <- ggNetView_multi_link(
mat = otu_rare_relative,
group_info = otu_sample,
transfrom.method = "none",
r.threshold = 0.7,
p.threshold = 0.05,
method = "WGCNA",
cor.method = "pearson",
proc = "BH",
module.method = "Fast_greedy",
layout = "circular_modules_equal_gephi_layout",
layout.module = "order",
top_modules = 15,
scale_groups = T,
add_outer = "circle",
r = 5,
jitter = F,
anchor_dist = 1,
layout_anchor_dist = 150,
seed = 1115,
dropOthers = T,
link_level = "Module&Node2", # bundled module-level + node-level cross-group links
add_group_outer = T # draw a translucent boundary around each group
)## Scale for size is already present.
## Adding another scale for size, which will replace the existing scale.
## Scale for size is already present.
## Adding another scale for size, which will replace the existing scale.
p_multi_link2 <- out_multi_link2[["p"]]
p_multi_link2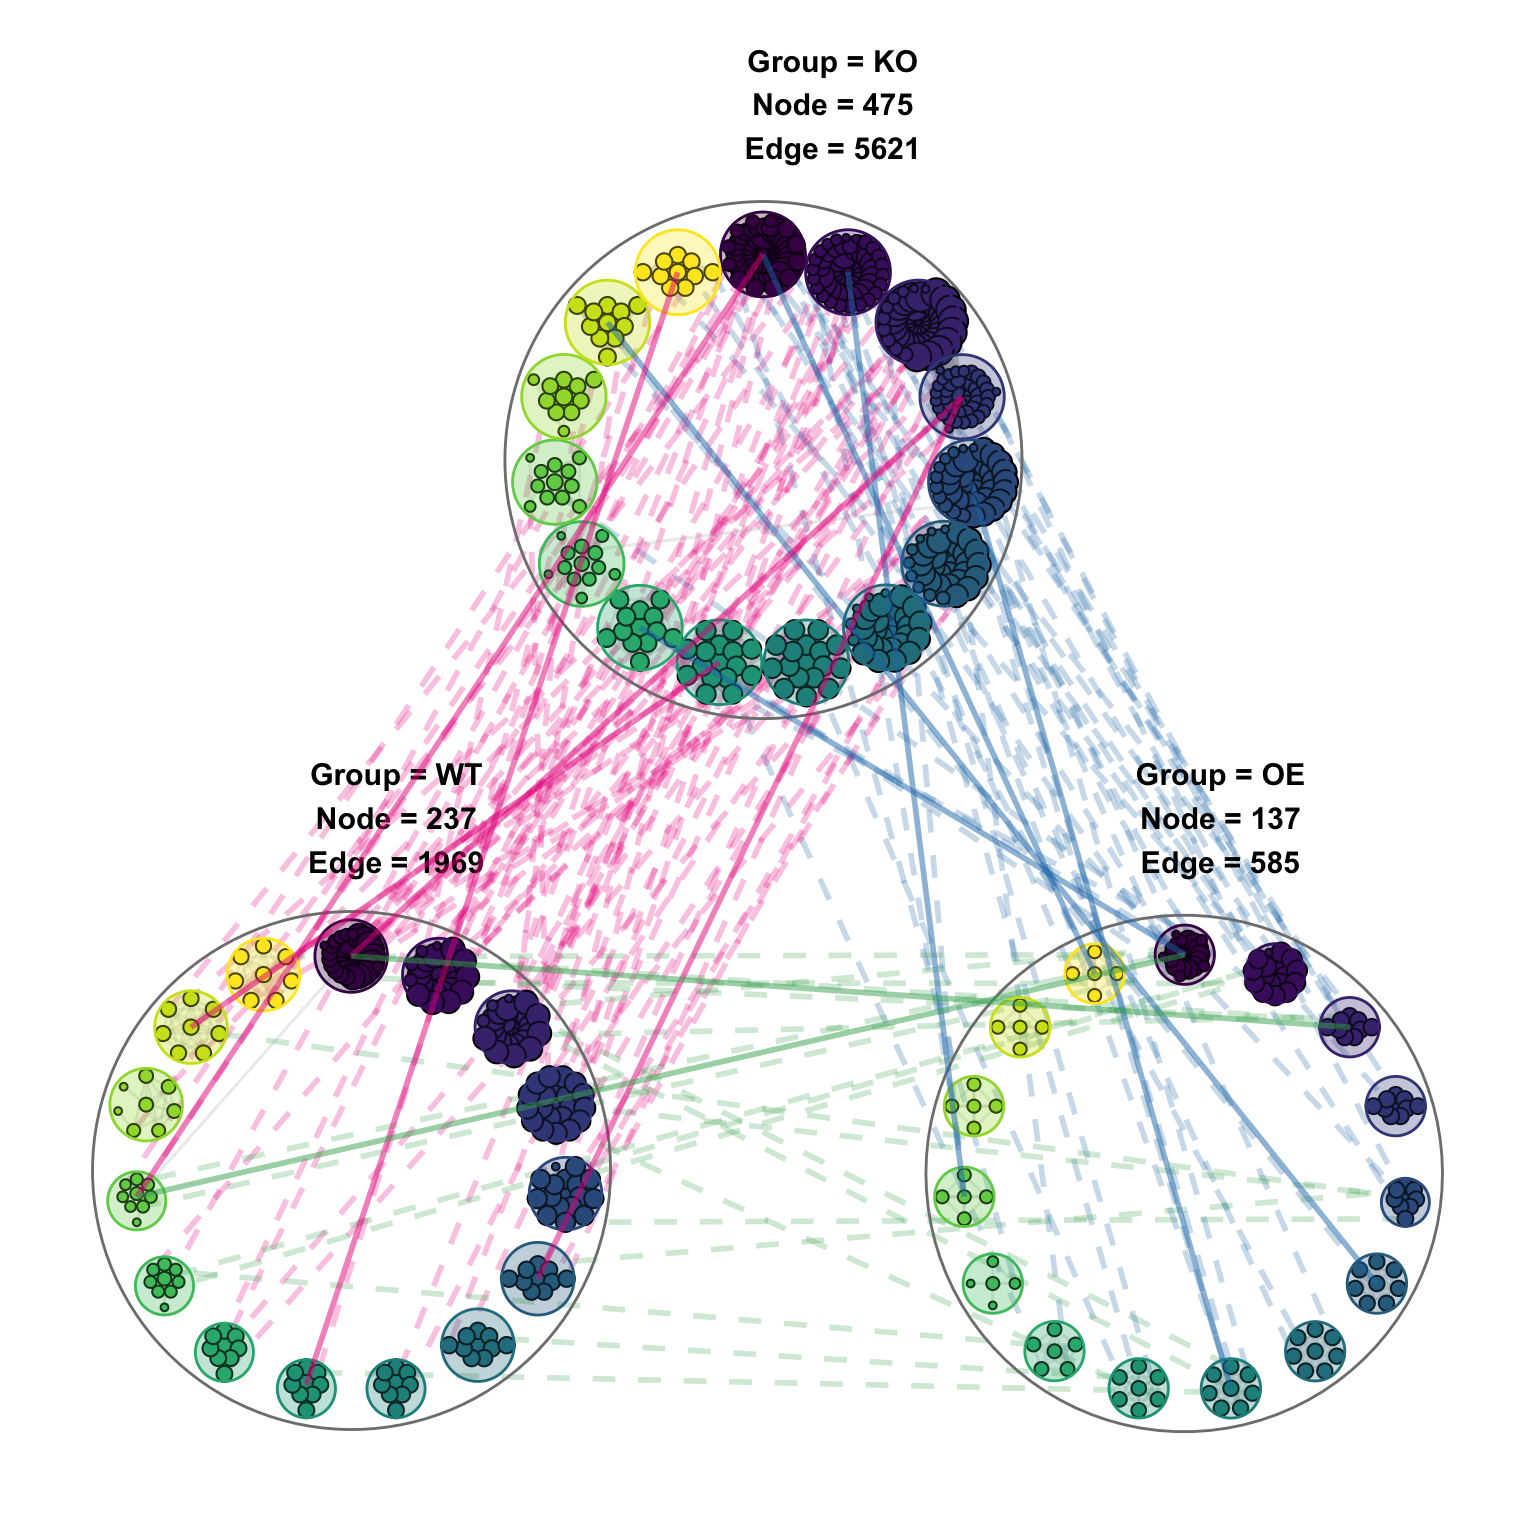
9.1.6 add group compare
# ---- Add cross-group comparison brackets + heavy styling -----------------
# This example shows almost every styling knob the function exposes:
# curved cross-group links, group-comparison annotations, per-group ring
# colours, custom module/node link palettes, etc.
out_multi_link3 <- ggNetView_multi_link(
mat = otu_rare_relative,
group_info = otu_sample,
transfrom.method = "none",
r.threshold = 0.7,
p.threshold = 0.05,
method = "WGCNA",
cor.method = "pearson",
proc = "BH",
module.method = "Fast_greedy",
layout = "circular_modules_equal_gephi_layout",
layout.module = "order",
top_modules = 15,
scale_groups = T,
add_outer = "circle",
r = 5,
jitter = F,
anchor_dist = 1,
layout_anchor_dist = 150,
seed = 1115,
dropOthers = T,
link_level = "Module&Node2",
link_curve = T, # draw cross-group links as curves (not straight)
link_curve_mode = "cross", # curve geometry: "cross" bends links across the centre
link_curve_adaptive_range = c(0.7, 1.5), # min/max curvature; adapts to link length
link_curve_adaptive_bins = 7, # # of bins used to map link length -> curvature
comparisons = T, # draw group-comparison brackets (like ggpubr style)
comparisons_groups = list( # which group pairs to highlight
c("WT", "KO"),
c("WT", "OE")
),
order = c("WT", "KO", "OE"), # MUST contain ALL unique groups in `group_info$Group`
add_group_outer = T, # draw a coloured ring around each group
add_group_outer_color = c("steelblue", "coral", "forestgreen"), # ring border colours (one per group)
add_group_outer_fill = c("#d0d1e6", "#fee391", "#e5f5e0"), # ring fill colours (one per group)
add_group_outer_fill_alpha = 0.3, # ring fill transparency
add_group_outer_linewidth = 1, # ring border line width
link_color_module = c("#de2d26", "#756bb1"), # palette for MODULE-level cross-group links
link_color_node = c("#c7e9c0", "#c6dbef"), # palette for NODE-level cross-group links
link_linewidth_module = c(1.5, 1.5), # line widths for module-level links
link_linealpha_module = 0.6, # alpha for module-level links
link_linealpha_node = 1, # alpha for node-level links
link_linewidth_node = 0.5, # line width for node-level links
add_group_outer_expand = 2.5 # how much the outer ring is expanded outward beyond node positions
)## Scale for size is already present.
## Adding another scale for size, which will replace the existing scale.
## Scale for size is already present.
## Adding another scale for size, which will replace the existing scale.
p_multi_link3 <- out_multi_link3[["p"]]
p_multi_link3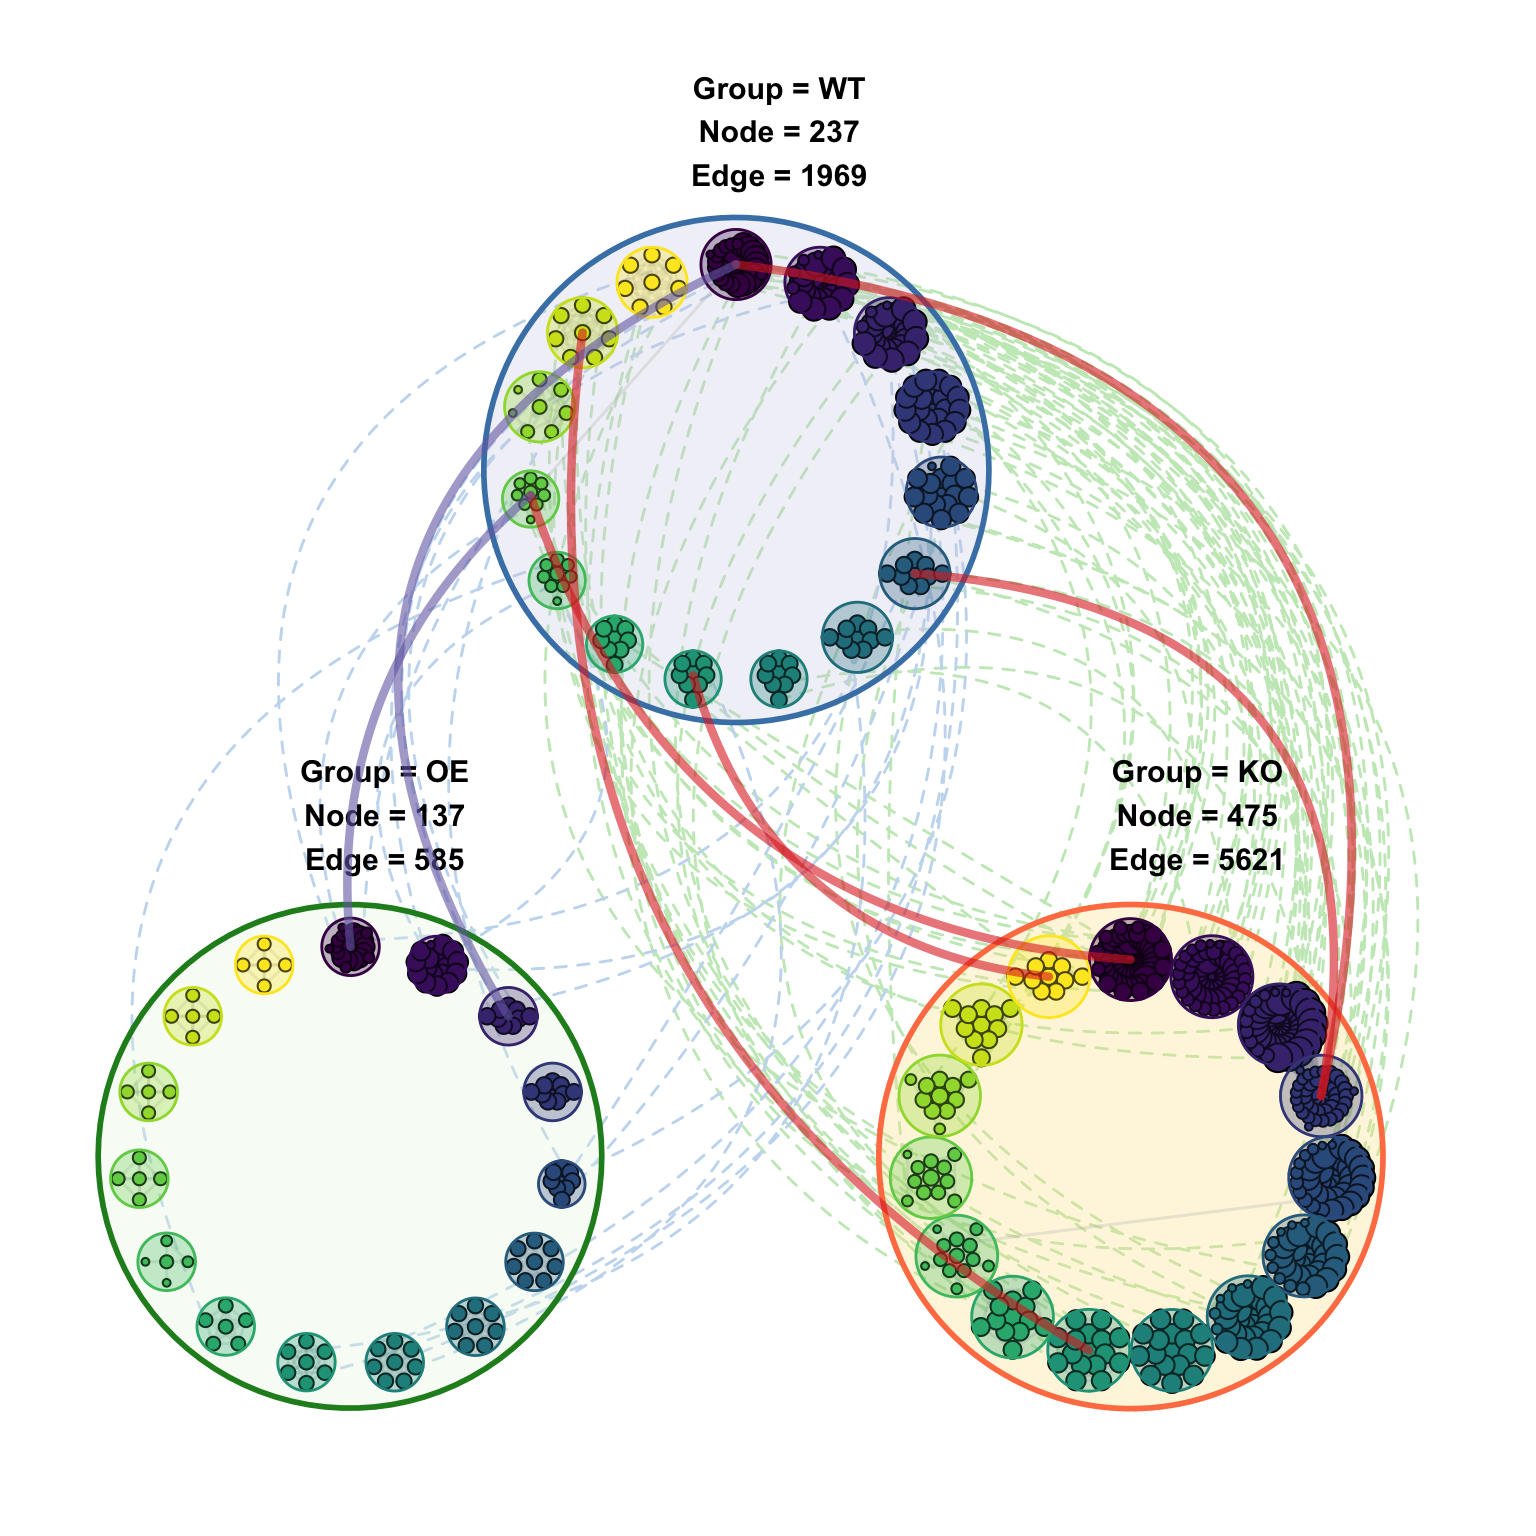
9.2 multi network (4 groups)
# ---- Build a 4-group dataset by duplicating the first 6 samples as a fake "ko" group ----
# This is purely for demoing the multi-group layouts below; the new "ko" group
# carries the same abundance values as samples 1:6, just with renamed columns.
otu_rare_relative2 <- otu_rare_relative %>%
dplyr::bind_cols(otu_rare_relative %>%
dplyr::select(1:6) %>%
purrr::set_names(paste0("ko", 1:6))) # 6 new fake samples named ko1..ko6
otu_sample2 <- otu_sample %>%
dplyr::bind_rows(otu_sample %>%
dplyr::slice(1:6) %>%
dplyr::mutate(Sample = paste0("ko", 1:6),
Group = rep("ko", 6))) # 6 new metadata rows, Group = "ko"9.2.1 group_layout = “row”
# ---- Place the 4 sub-networks on a single ROW ----
# `group_layout = "row"` puts all groups along one horizontal line (nrow = 1).
out_group4_1 <- ggNetView_multi_link(
mat = otu_rare_relative2,
group_info = otu_sample2,
transfrom.method = "none",
r.threshold = 0.7,
p.threshold = 0.05,
method = "WGCNA",
cor.method = "pearson",
proc = "BH",
module.method = "Fast_greedy",
layout.module = "random",
center = T,
top_modules = 10,
layout = "gephi",
group_layout = "row", # group-frame layout: "row" / "square" / "triangle_down" / "snake_vertical" / ...
nrow = 1, # # of rows used when `group_layout = "row"` / grid-like layouts
shrink = 0.9,
scale_groups = T,
add_outer = "manual", # outer frame drawn manually (uses `r`)
r = 12.5, # radius of each per-group sub-network
jitter = T,
jitter_sd = 0.01,
anchor_dist = 1.25,
layout_anchor_dist = 175,
seed = 1115,
orientation = "up",
dropOthers = T,
angle = 0,
node_add = 10, # extra padding (in coord units) added around each sub-network
pointsize = c(1, 3), # node-size range (min, max) mapped from a node-level numeric (e.g. Degree)
link_level = "Module&Node2",
comparisons = T,
comparisons_groups = list( # group pairs to bracket; all names MUST be valid groups
c("WT", "KO"),
c("KO", "ko"),
c("ko", "OE")
),
order = c("WT", "KO", "ko", "OE"), # MUST list ALL 4 unique groups
add_group_outer = T,
add_group_outer_fill_alpha = 0.3,
add_group_outer_linewidth = 1,
link_linealpha_module = 0.6,
link_linewidth_node = 0.5,
add_group_outer_expand = 2.5
)## Scale for size is already present.
## Adding another scale for size, which will replace the existing scale.
## Scale for size is already present.
## Adding another scale for size, which will replace the existing scale.
## Scale for size is already present.
## Adding another scale for size, which will replace the existing scale.
p_group_4_1 <- out_group4_1[["p"]]
p_group_4_1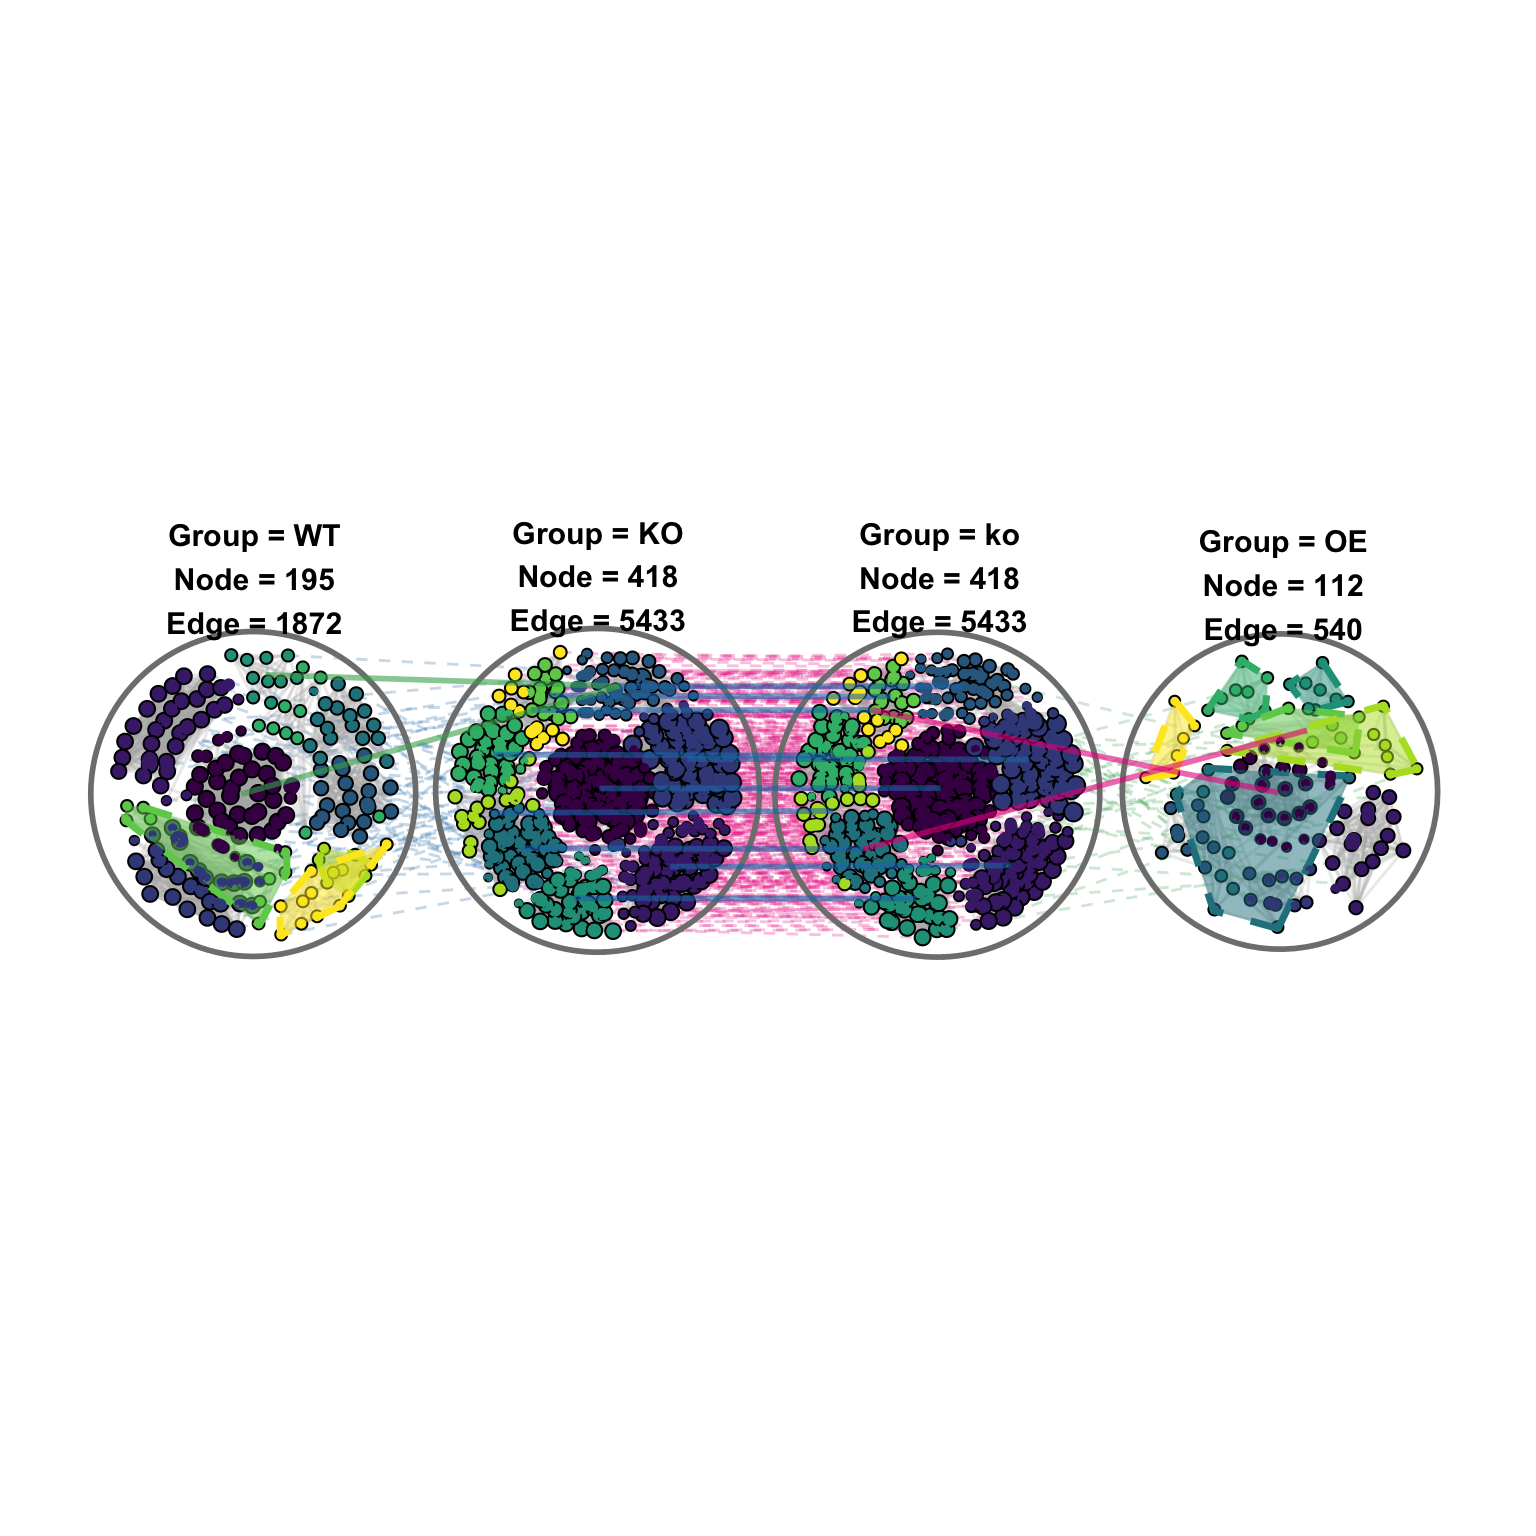
9.2.2 group_layout = “square”
# ---- Place the 4 sub-networks on a 2x2 SQUARE grid ----
# `group_layout = "square"` arranges groups in a square frame (4 corners for 4 groups).
out_group4_2 <- ggNetView_multi_link(
mat = otu_rare_relative2,
group_info = otu_sample2,
transfrom.method = "none",
r.threshold = 0.7,
p.threshold = 0.05,
method = "WGCNA",
cor.method = "pearson",
proc = "BH",
module.method = "Fast_greedy",
layout.module = "order",
center = T,
top_modules = 10,
layout = "circular_modules_equal_gephi_layout",
group_layout = "square", # 2x2 grid for 4 groups
scale_groups = T,
add_outer = "circle",
r = 12.5,
jitter = T,
jitter_sd = 0.01,
anchor_dist = 1.25,
layout_anchor_dist = 175,
seed = 1115,
orientation = "up",
dropOthers = T,
angle = 0,
node_add = 10,
pointsize = c(1, 3),
link_level = "Module&Node2",
comparisons = T,
comparisons_groups = list(
c("WT", "KO"),
c("WT", "ko"),
c("WT", "OE")
),
order = c("WT", "KO", "ko", "OE"), # all 4 groups
add_group_outer = T,
add_group_outer_color = c("steelblue", "coral", "forestgreen", "#756bb1"), # one border colour per group
add_group_outer_fill = c("#deebf7", "#fee391", "#e5f5e0", "#efedf5"), # one fill colour per group
add_group_outer_fill_alpha = 0.4,
add_group_outer_linewidth = 1,
link_color_module = c("#de2d26", "#756bb1", "#2c7fb8"), # one colour per comparison pair (module-level)
link_color_node = c("#c7e9c0", "#c6dbef", "#fde0dd"), # one colour per comparison pair (node-level)
link_linewidth_module = c(1.5, 1.5, 1.5),
link_linealpha_module = 0.6,
link_linealpha_node = 1,
link_linewidth_node = 0.5,
add_group_outer_expand = 2.5
)## Scale for size is already present.
## Adding another scale for size, which will replace the existing scale.
## Scale for size is already present.
## Adding another scale for size, which will replace the existing scale.
## Scale for size is already present.
## Adding another scale for size, which will replace the existing scale.
p_group_4_2 <- out_group4_2[["p"]]
p_group_4_2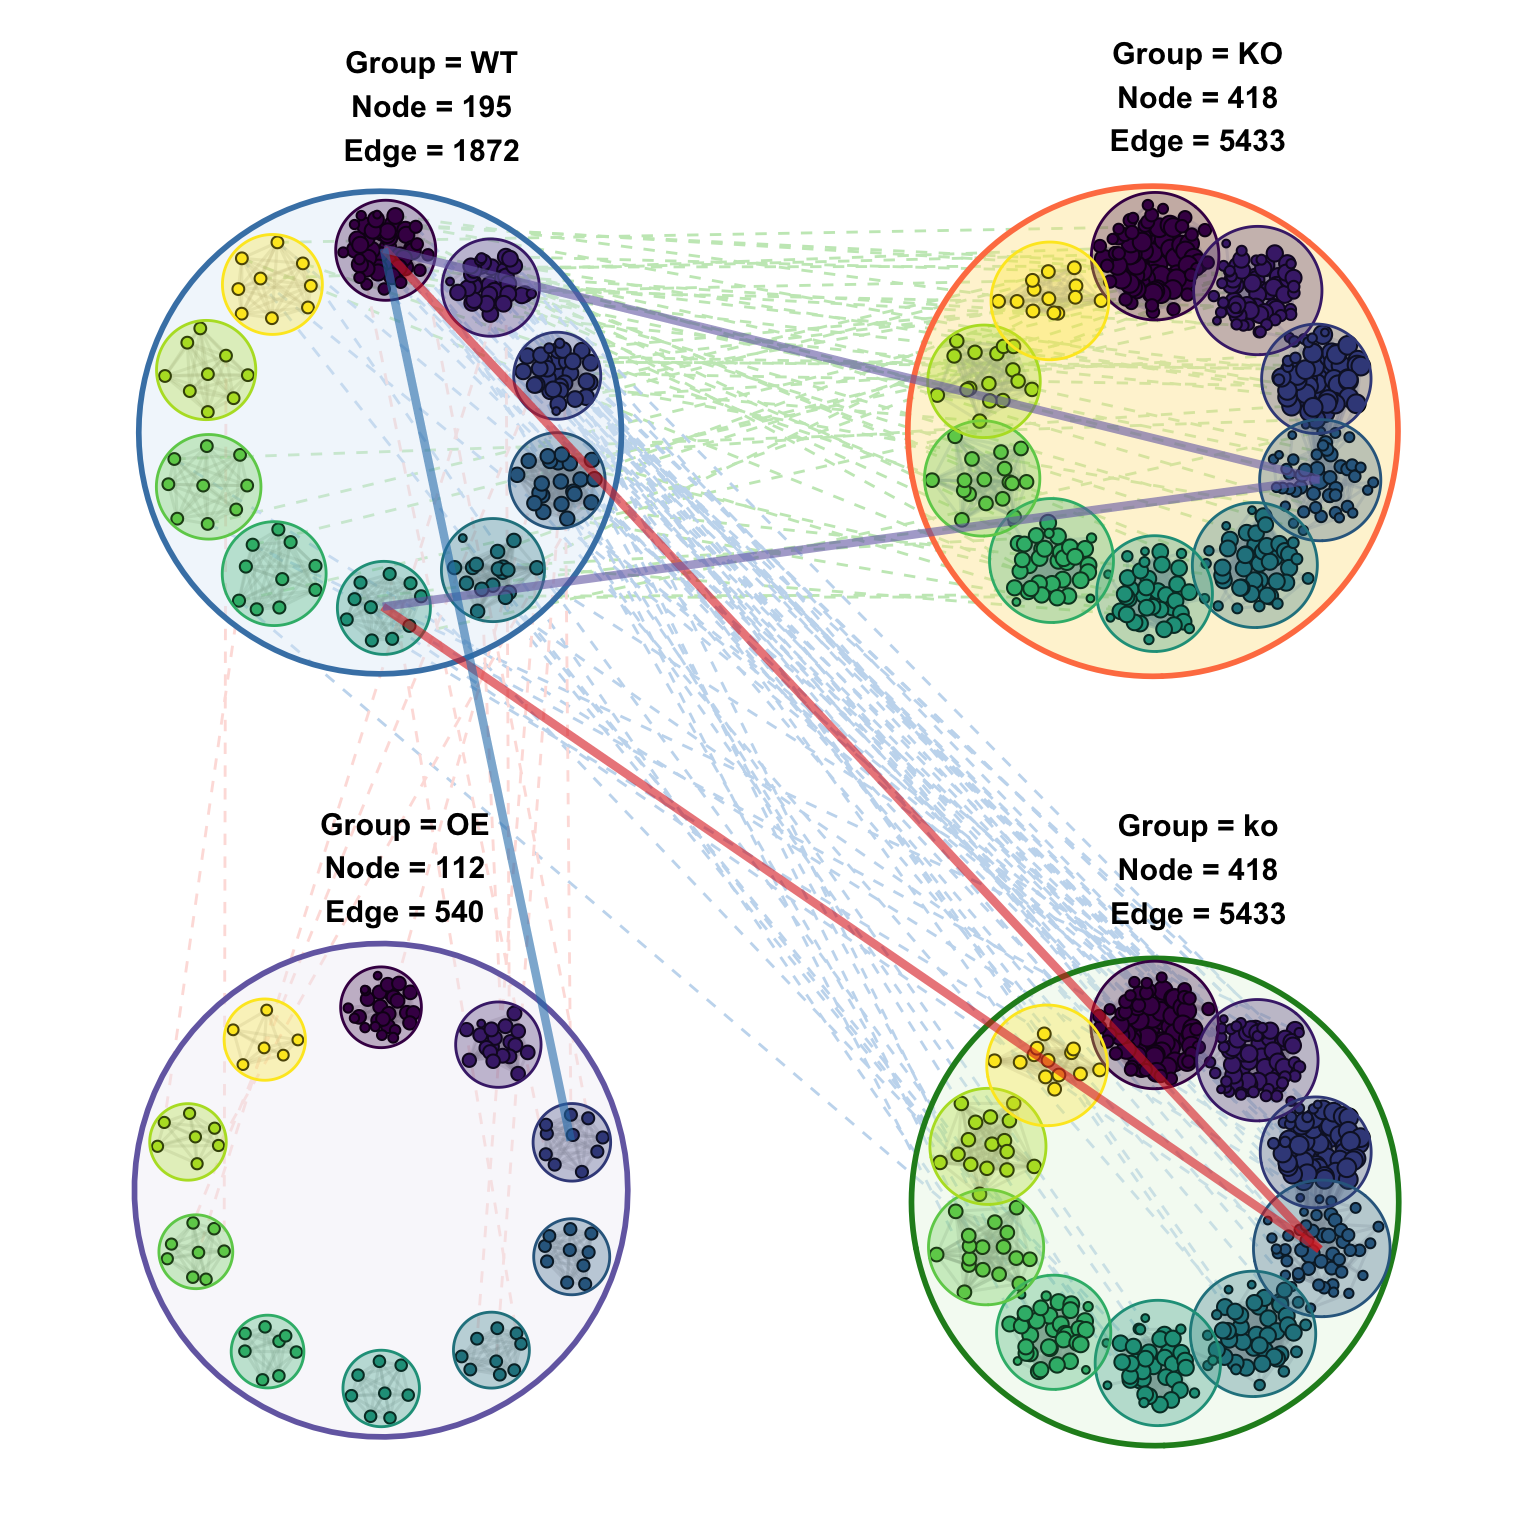
9.3 multi network (8 groups)
# ---- Build an 8-group dataset by repeatedly recycling otu_rare_relative columns ----
# This is purely for demoing the 8-group layouts below; abundance values are
# borrowed from the original matrix and renamed so each fake group has 6 samples.
otu_rare_relative3 <- otu_rare_relative %>%
dplyr::bind_cols(otu_rare_relative %>% dplyr::select(1:6) %>% purrr::set_names(paste0("ko", 1:6))) %>%
dplyr::bind_cols(otu_rare_relative %>% dplyr::select(7:12) %>% purrr::set_names(paste0("oe", 1:6))) %>%
dplyr::bind_cols(otu_rare_relative %>% dplyr::select(13:18) %>% purrr::set_names(paste0("wt", 1:6))) %>%
dplyr::bind_cols(otu_rare_relative %>% dplyr::select(1:6) %>% purrr::set_names(paste0("aaa", 1:6))) %>%
dplyr::bind_cols(otu_rare_relative %>% dplyr::select(7:12) %>% purrr::set_names(paste0("bbb", 1:6)))
otu_sample3 <- otu_sample %>%
dplyr::bind_rows(otu_sample %>% dplyr::slice(1:6) %>%
dplyr::mutate(Sample = paste0("ko", 1:6), Group = rep("ko", 6))) %>%
dplyr::bind_rows(otu_sample %>% dplyr::slice(1:6) %>%
dplyr::mutate(Sample = paste0("oe", 1:6), Group = rep("oe", 6))) %>%
dplyr::bind_rows(otu_sample %>% dplyr::slice(1:6) %>%
dplyr::mutate(Sample = paste0("wt", 1:6), Group = rep("wt", 6))) %>%
dplyr::bind_rows(otu_sample %>% dplyr::slice(1:6) %>%
dplyr::mutate(Sample = paste0("aaa", 1:6), Group = rep("aaa", 6))) %>%
dplyr::bind_rows(otu_sample %>% dplyr::slice(1:6) %>%
dplyr::mutate(Sample = paste0("bbb", 1:6), Group = rep("bbb", 6)))
# Final groups in otu_sample3 (8 total, CASE-SENSITIVE):
# "WT", "KO", "OE" (from the original 18 samples)
# "ko", "oe", "wt", "aaa", "bbb" (from the bind_rows additions)9.3.1 group_layout = “triangle_down”
# ---- Place the 8 sub-networks on a downward-pointing TRIANGLE frame ----
# `group_layout = "triangle_down"` arranges groups along a triangular outline
# with the apex pointing down. Useful for emphasising hierarchy or a "funnel"
# narrative across groups.
out_group4_1 <- ggNetView_multi_link(
mat = otu_rare_relative3,
group_info = otu_sample3,
transfrom.method = "none",
r.threshold = 0.7,
p.threshold = 0.05,
method = "WGCNA",
cor.method = "pearson",
proc = "BH",
module.method = "Fast_greedy",
layout.module = "random",
center = T,
top_modules = 10,
layout = "gephi",
group_layout = "triangle_down",
nrow = 1,
shrink = 0.9,
scale_groups = T,
add_outer = "manual",
r = 5,
jitter = T,
jitter_sd = 0.01,
anchor_dist = 2,
layout_anchor_dist = 250,
seed = 1115,
orientation = "up",
dropOthers = T,
angle = 0,
node_add = 10,
pointsize = c(1, 3),
link_level = "Module&Node2",
comparisons = T,
comparisons_groups = list(c("WT", "wt"),
c("wt", "KO"),
c("KO", "ko"),
c("ko", "OE"),
c("OE", "oe"),
c("oe", "aaa"),
c("aaa", "bbb")),
order = c("WT", "wt", "KO", "ko", "OE", "oe", "aaa", "bbb"), # all 8 groups in display order
add_group_outer = T,
add_group_outer_fill_alpha = 0.3,
add_group_outer_linewidth = 1,
link_linealpha_module = 0.6,
link_linewidth_node = 0.5,
add_group_outer_expand = 2.5
)## Scale for size is already present.
## Adding another scale for size, which will replace the existing scale.
## Scale for size is already present.
## Adding another scale for size, which will replace the existing scale.
## Scale for size is already present.
## Adding another scale for size, which will replace the existing scale.
## Scale for size is already present.
## Adding another scale for size, which will replace the existing scale.
## Scale for size is already present.
## Adding another scale for size, which will replace the existing scale.
## Scale for size is already present.
## Adding another scale for size, which will replace the existing scale.
## Scale for size is already present.
## Adding another scale for size, which will replace the existing scale.
p_group_4_1 <- out_group4_1[["p"]]
p_group_4_1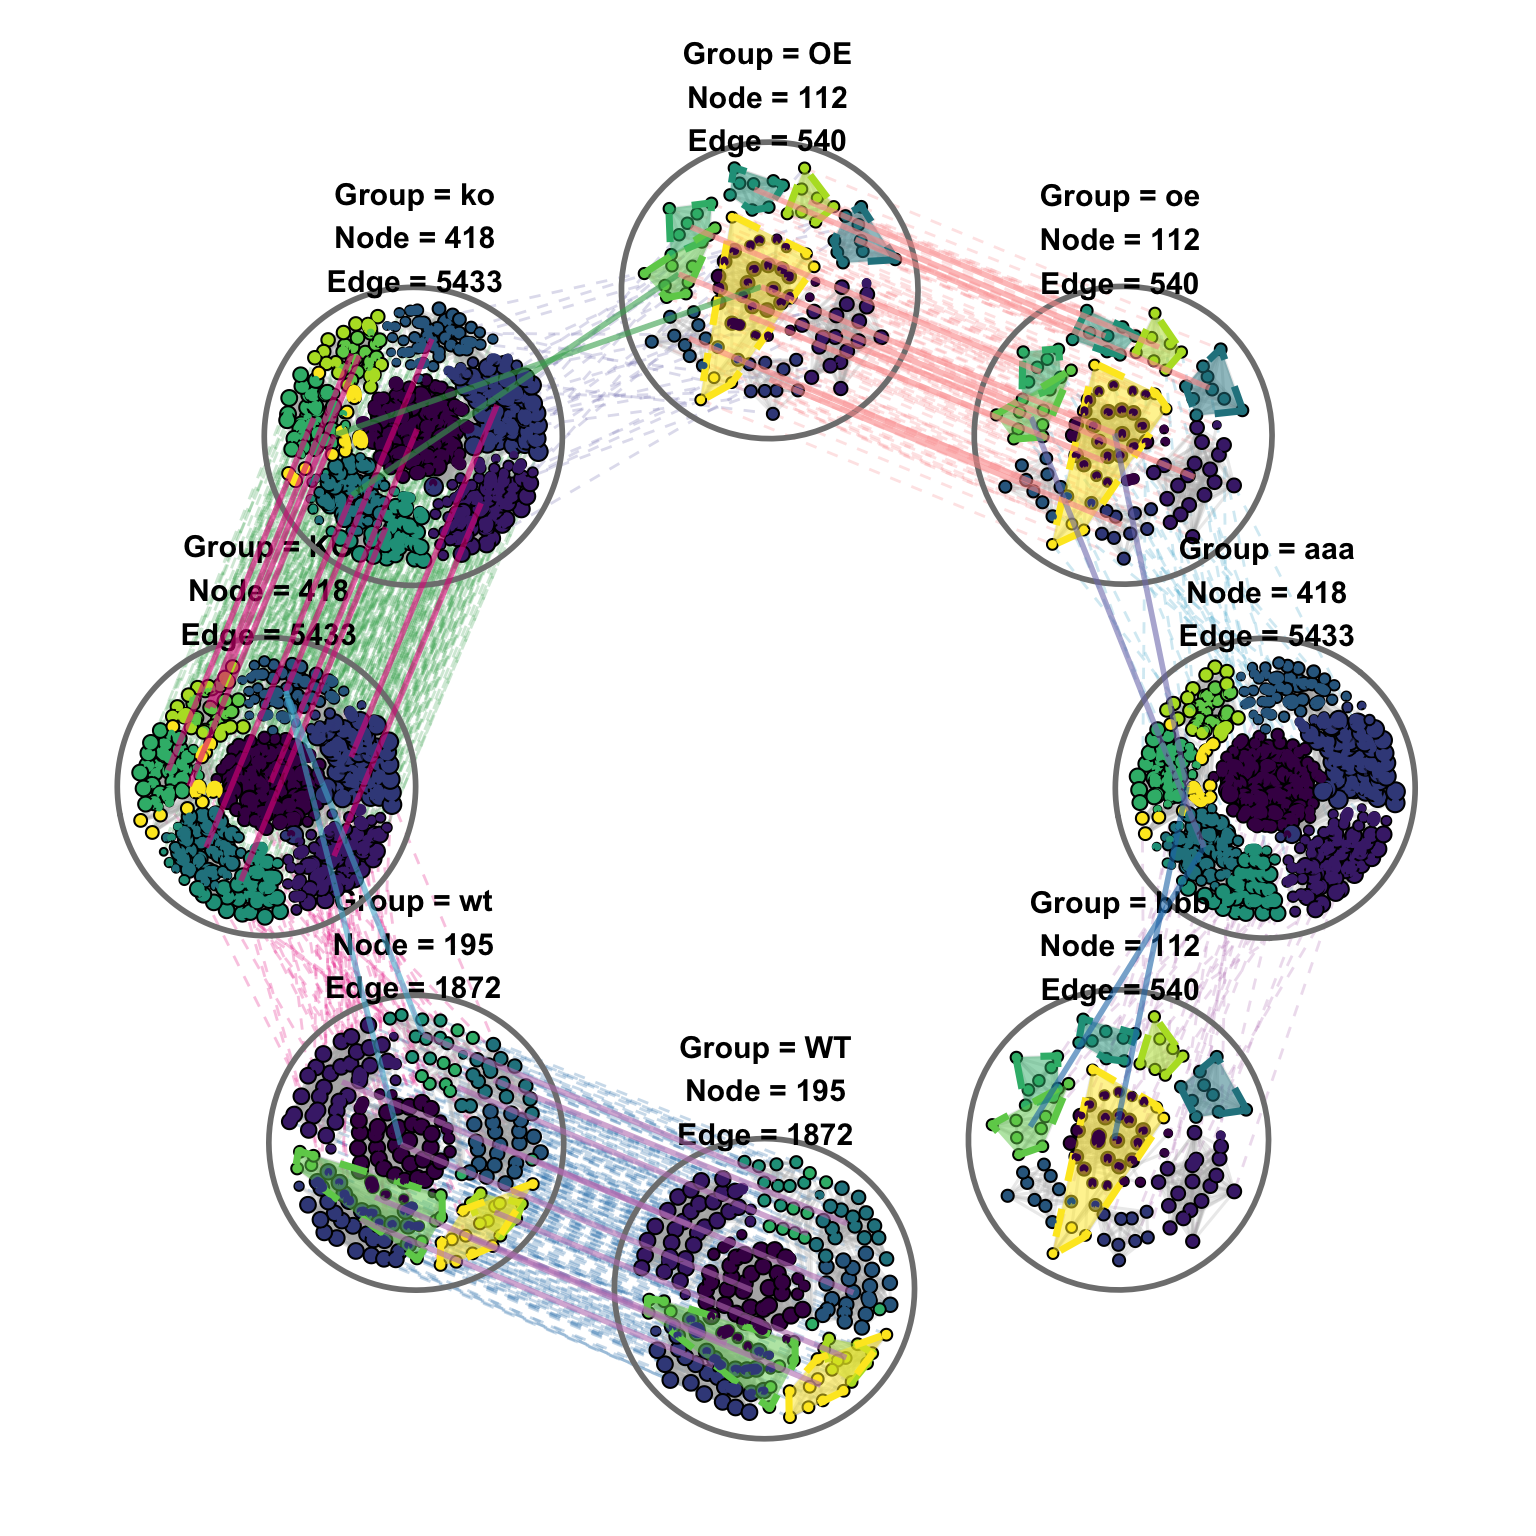
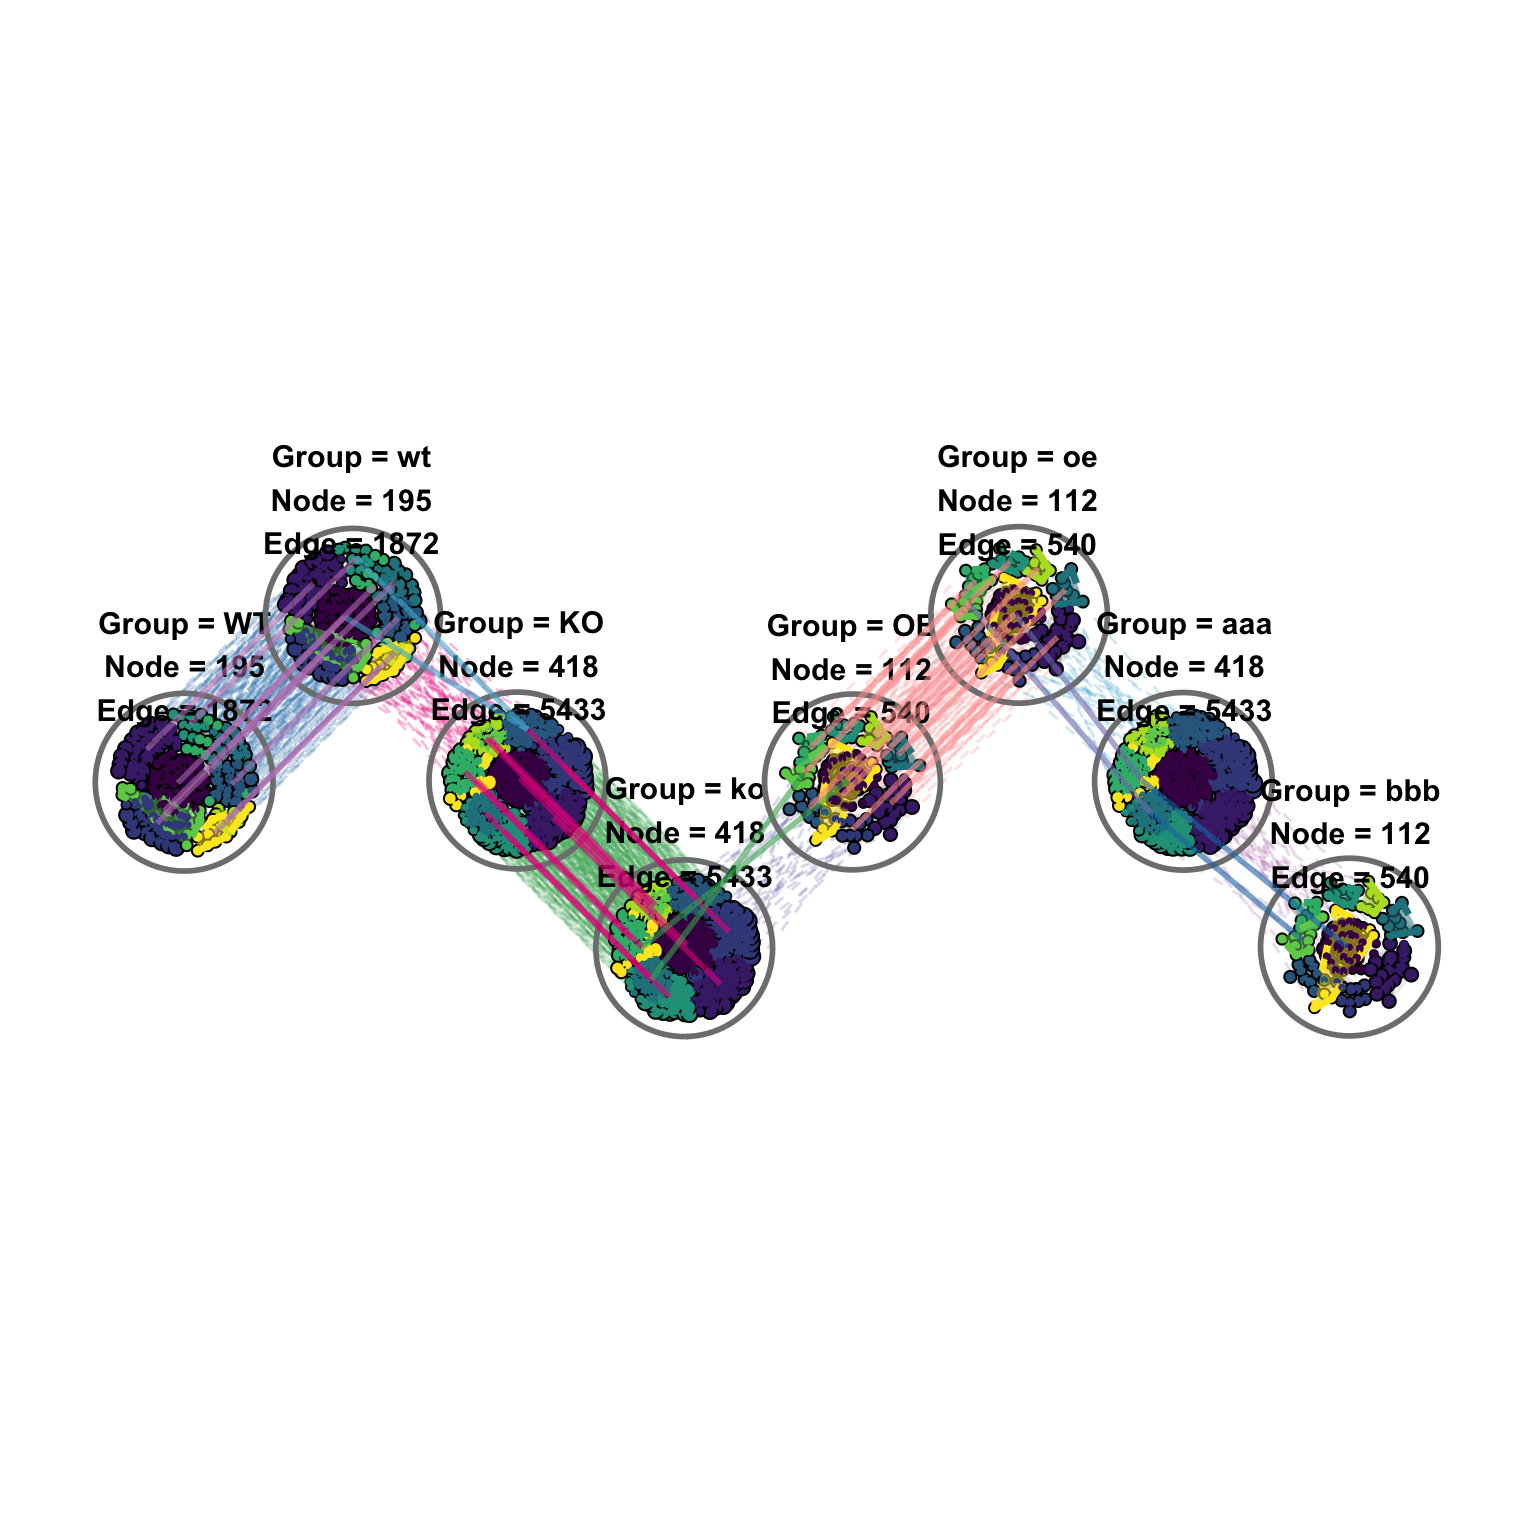
9.3.2 group_layout = “snake_vertical”
# ---- Place sub-networks in a vertical SNAKE (zig-zag) frame ----
# `group_layout = "snake_vertical"` runs groups down-up-down... along a vertical
# meander. Useful when you have many groups and want them to fit a tall canvas.
out_group4_1 <- ggNetView_multi_link(
mat = otu_rare_relative3, # NOTE: this is the 4-group dataset
group_info = otu_sample3, # NOTE: this is the 4-group metadata
transfrom.method = "none",
r.threshold = 0.7,
p.threshold = 0.05,
method = "WGCNA",
cor.method = "pearson",
proc = "BH",
module.method = "Fast_greedy",
layout.module = "random",
center = T,
top_modules = 10,
layout = "gephi",
group_layout = "snake_vertical",
nrow = 1,
shrink = 0.9,
scale_groups = T,
add_outer = "manual",
r = 10,
jitter = T,
jitter_sd = 0.01,
anchor_dist = 1.25,
layout_anchor_dist = 175,
seed = 1115,
orientation = "up",
dropOthers = T,
angle = 0,
node_add = 10,
pointsize = c(1, 3),
link_level = "Module&Node2",
comparisons = T,
comparisons_groups = list(c("WT", "wt"),
c("wt", "KO"),
c("KO", "ko"),
c("ko", "OE"),
c("OE", "oe"),
c("oe", "aaa"),
c("aaa", "bbb")),
order = c("WT", "wt", "KO", "ko", "OE", "oe", "aaa", "bbb"), # 8 names, but data only has 4 groups -> will error
add_group_outer = T,
add_group_outer_fill_alpha = 0.3,
add_group_outer_linewidth = 1,
link_linealpha_module = 0.6,
link_linewidth_node = 0.5,
add_group_outer_expand = 2.5
)## Scale for size is already present.
## Adding another scale for size, which will replace the existing scale.
## Scale for size is already present.
## Adding another scale for size, which will replace the existing scale.
## Scale for size is already present.
## Adding another scale for size, which will replace the existing scale.
## Scale for size is already present.
## Adding another scale for size, which will replace the existing scale.
## Scale for size is already present.
## Adding another scale for size, which will replace the existing scale.
## Scale for size is already present.
## Adding another scale for size, which will replace the existing scale.
## Scale for size is already present.
## Adding another scale for size, which will replace the existing scale.
p_group_4_1 <- out_group4_1[["p"]]
p_group_4_1