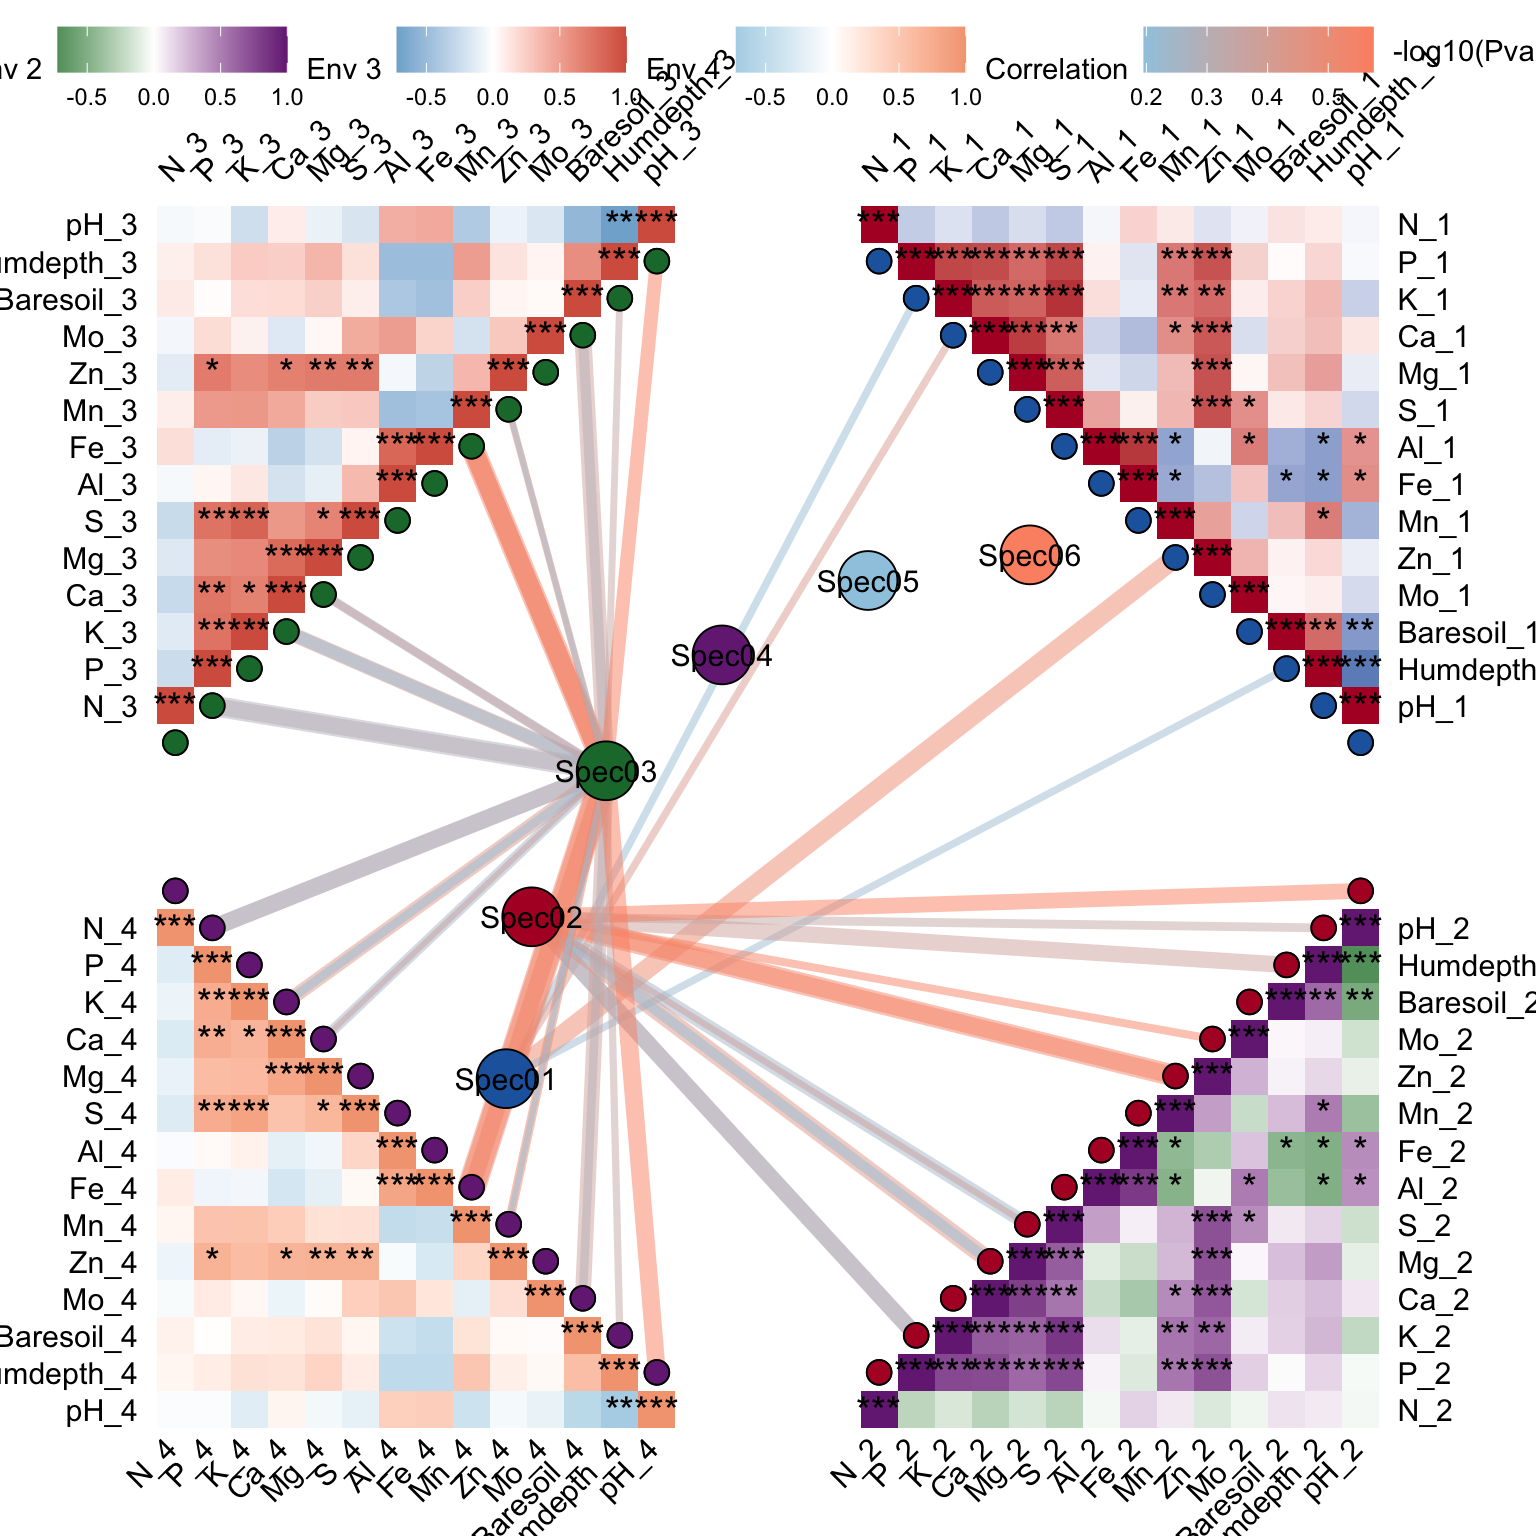
10 Network & Environment
Load R Package
library(tidyverse)   # data manipulation / piping utilities
library(ggNetView)   # graph builders + info-extraction helpers
Example data
# Built-in example datasets shipped with ggNetView:
#   `Envdf_4st` - environmental table (samples x env variables)
#   `Spedf`     - species/feature table (samples x species)
# Row order MUST match between the two tables.
data("Envdf_4st")
data("Spedf")
10.1 Network Environment (one core with 4 Envrionment matrix)
# ---- Plot: 1 central species block + 4 environmental heatmap quadrants ----
# `relation_method = "correlation"` means spec-env links are based on
# correlations (psych::corr.test) rather than community distance / mantel.
out1 <- gglink_heatmaps(
  env                = Envdf_4st,           # environmental table: rows = samples, cols = env factors
  spec               = Spedf,               # species table: rows = samples (same order as env), cols = species
  env_select         = list(                # one heatmap quadrant per env block (length must match `orientation`)
    Env01 = 1:14,
    Env02 = 15:28,
    Env03 = 29:42,
    Env04 = 43:56
  ),
  spec_select        = list(                # one central species network per block
    Spec01 = 1:8                            #   take species columns 1..8
  ),
  relation_method    = "correlation",       # spec-env link rule: "correlation" (vs "mantel" / "vegdist")
  spec_layout        = "circle_outline",    # shape of the central network: nodes on a circle outline
  cor.method         = "pearson",           # correlation method used for env-env tiles and spec-env links
  cor.use            = "pairwise",          # NA handling: use pairwise-complete observations
  r                  = 6,                   # effective radius of the central network
  distance           = 1,                   # offset between the central network and each surrounding heatmap
  HeatmapLabelOrient = 45,                  # rotate heatmap row/column labels 45 deg to avoid overlap
  HeatmapLabelSize   = 3,                   # smaller label font (3) since many labels are crammed at 45 deg
  orientation        = c(                   # which quadrant each env block lands in (paired with `env_select` in order)
    "top_right",
    "bottom_right",
    "top_left",
    "bottom_left"
  )
)
## The max module in network is 2 we use the 2 modules for next analysis
class(out1)## [1] "list"
length(out1)## [1] 3
out1[[1]] # gglink_heatmaps() returns a list of ggplot variants; [[1]] = the default view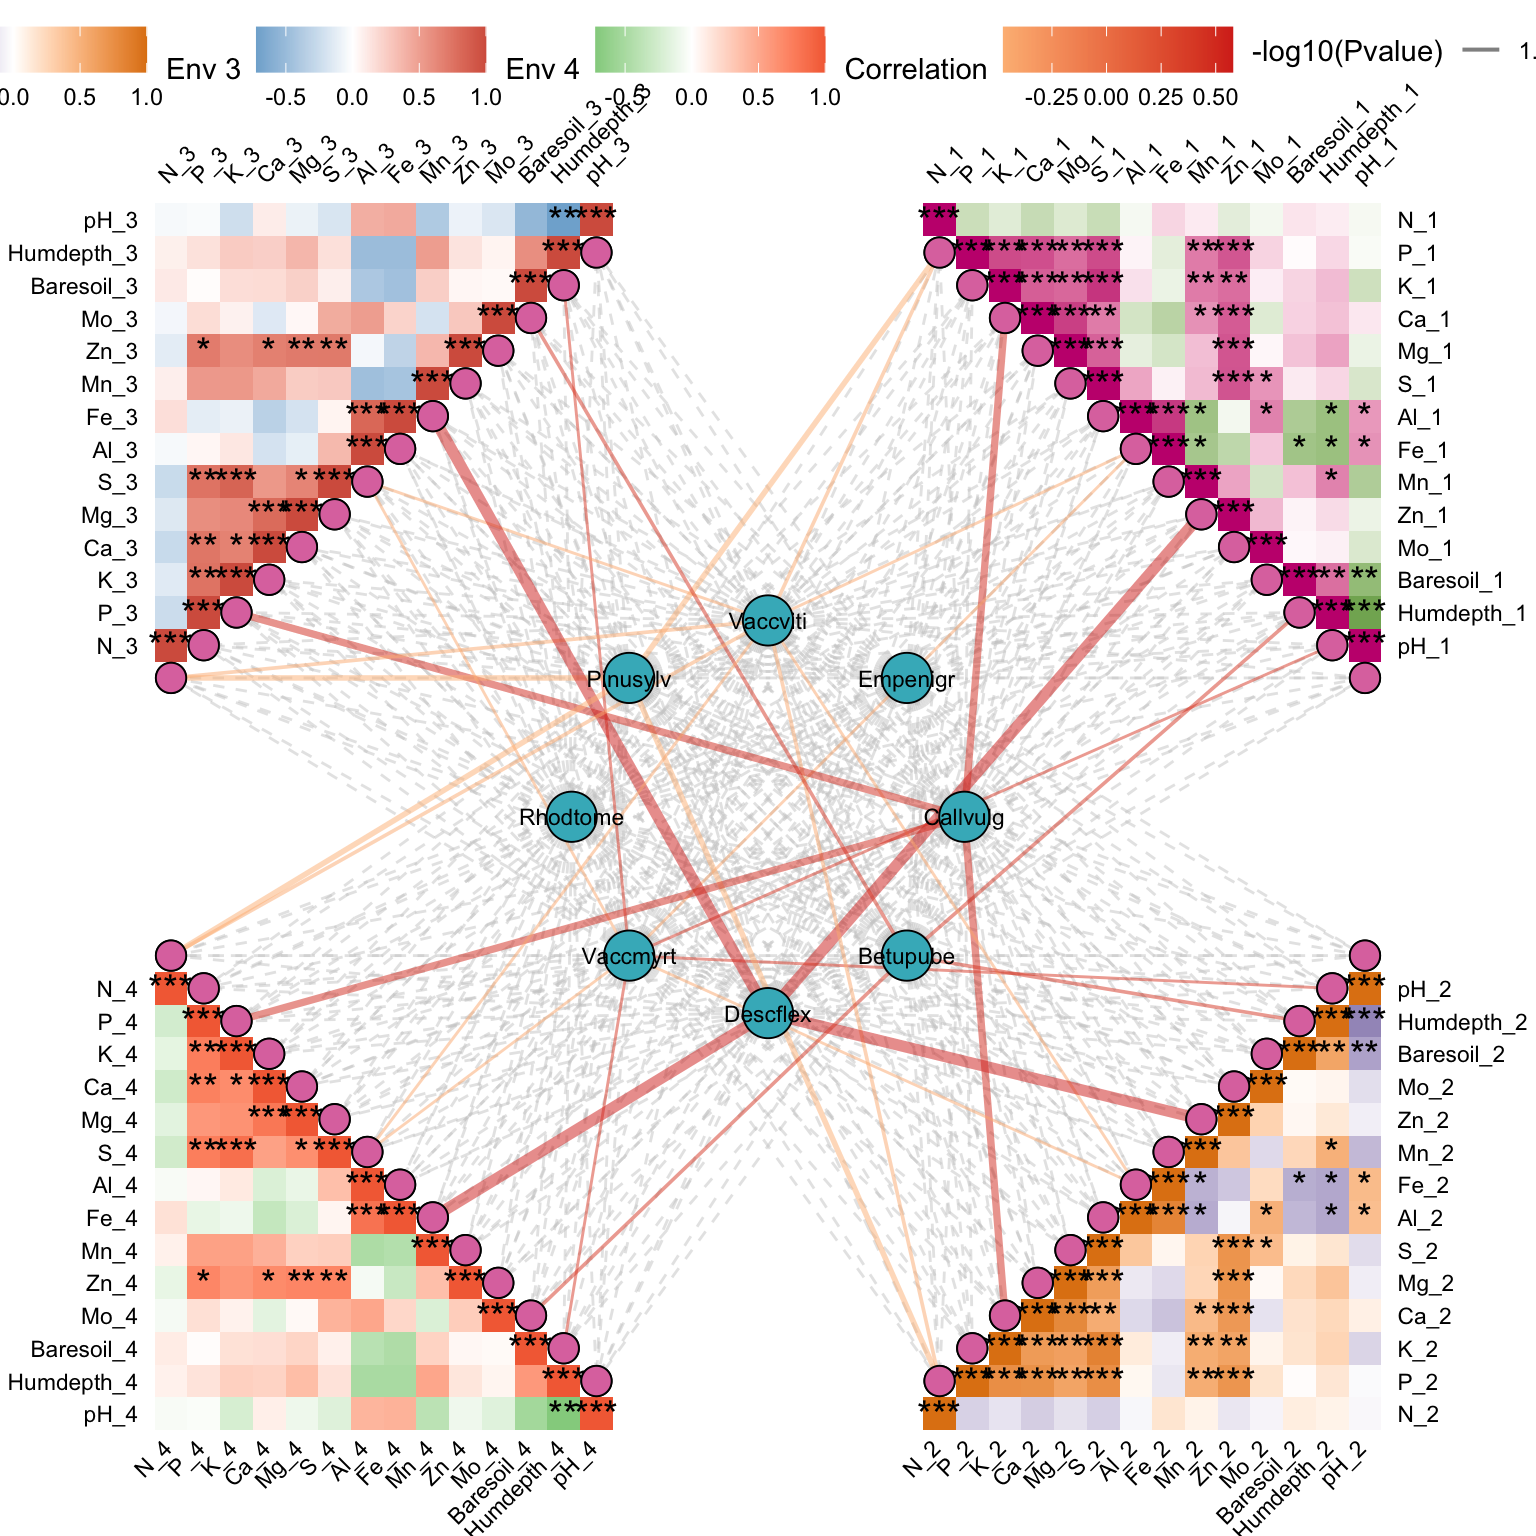
out1[[2]] # the 2nd ggplot variant (different style — legend / annotation layer)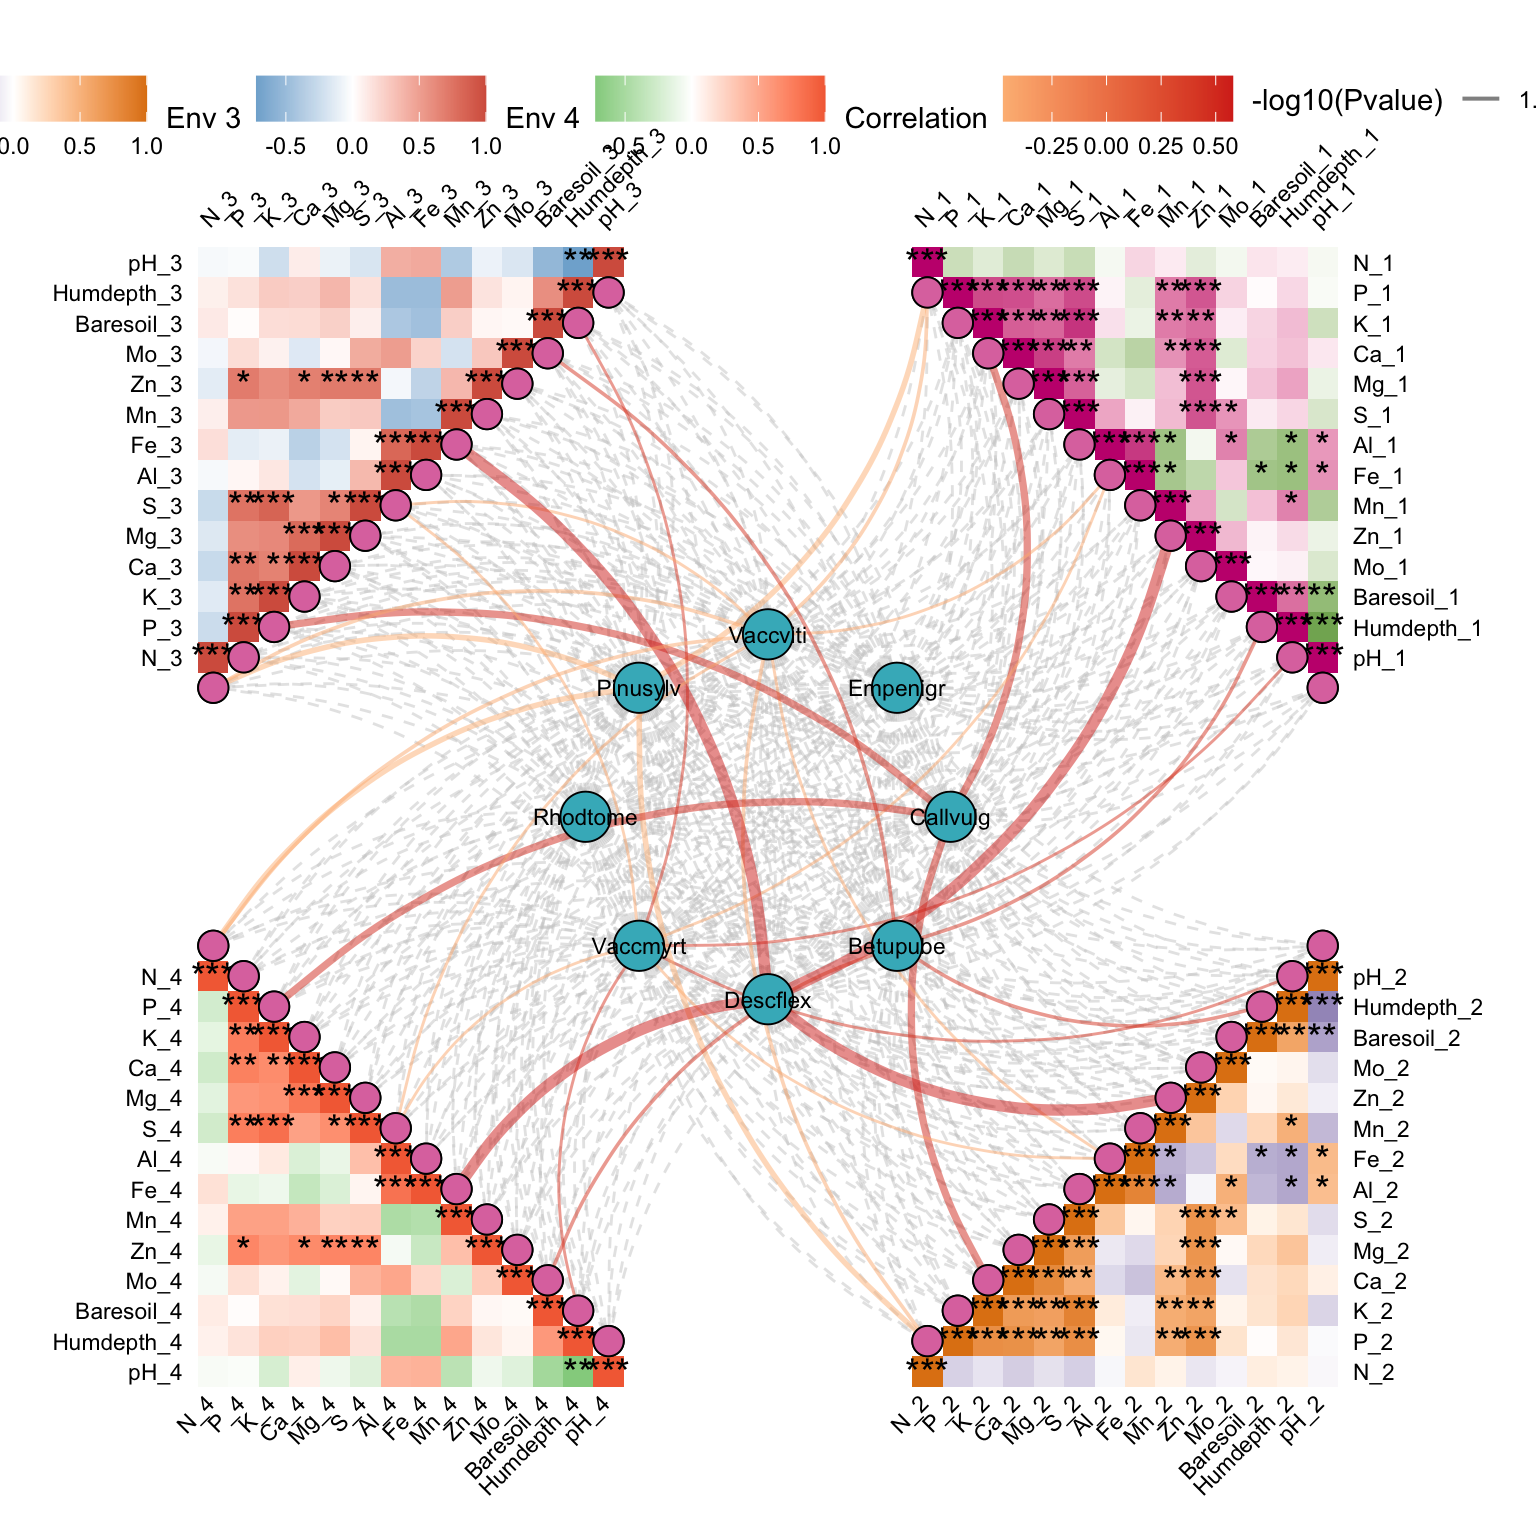
head(out1[[3]])## ID Type Correlation Pvalue p_signif spec_block env_block
## 1 Callvulg N_1 0.194775914 0.36174639 Spec01 Env01
## 2 Callvulg P_1 -0.089825004 0.67638229 Spec01 Env01
## 3 Callvulg K_1 0.508915172 0.01109495 * Spec01 Env01
## 4 Callvulg Ca_1 0.004323521 0.98400337 Spec01 Env01
## 5 Callvulg Mg_1 0.114475972 0.59428736 Spec01 Env01
## 6 Callvulg S_1 0.401157542 0.05203489 Spec01 Env01
## method
## 1 correlation
## 2 correlation
## 3 correlation
## 4 correlation
## 5 correlation
## 6 correlation10.2 Network Environment (one core with 3 Environment matrix)
# ---- Plot: 1 central species block + 3 environmental heatmap quadrants ----
# Like the 4-quadrant version, but with Env02 dropped and custom styling:
#   - drop_nonsig = TRUE     : hide non-significant spec-env links
#   - HeatmapColorBar        : custom low/high colour pair per quadrant
#   - HeatmapPointFill / CorePointFill : override default fill colours
out2 <- gglink_heatmaps(
  env                = Envdf_4st,           # environmental table: rows = samples, cols = env factors
  spec               = Spedf,               # species table: rows = samples (same order as env), cols = species
  env_select         = list(                # 3 env blocks -> 3 heatmap quadrants
    Env01 = 1:14,
    Env03 = 29:40,
    Env04 = 43:50
  ),
  spec_select        = list(Spec01 = 1:8),  # one central species network (species cols 1..8)
  relation_method    = "correlation",       # spec-env link rule: correlation (vs "mantel" / "vegdist")
  spec_layout        = "circle_outline",    # shape of the central network: nodes on a circle outline
  cor.method         = "pearson",           # correlation method for env-env tiles and spec-env links
  cor.use            = "pairwise",          # NA handling: pairwise-complete observations
  drop_nonsig        = TRUE,                # remove non-significant spec-env links from the plot (still kept in stats)
  HeatmapColorBar    = list(                # one low/high colour pair per env block (length = 3)
    c("#2166ac", "#b2182b"),  # quadrant 1: blue -> red
    c("#1b7837", "#762a83"),  # quadrant 2: green -> purple
    c("#4393c3", "#d6604d")   # quadrant 3: light blue -> brick
  ),
  HeatmapPointFill   = "#8c6bb1",           # fill of the diagonal anchor points on each heatmap
  CorePointFill      = "#225ea8",           # fill of the central species nodes
  HeatmapLabelOrient = 45,                  # rotate heatmap labels 45 deg to avoid overlap
  HeatmapLabelSize   = 3,                   # smaller label font (3) since many labels are crammed at 45 deg
  r                  = 6,                   # effective radius of the central network
  distance           = 1,                   # offset between the central network and each surrounding heatmap
  orientation        = c(                   # 3 quadrants — length MUST match `env_select`
    "top_right",
    "top_left",
    "bottom_left"
  )
)
## The max module in network is 2 we use the 2 modules for next analysis
out2[[1]] # default view (1st ggplot variant from the returned list)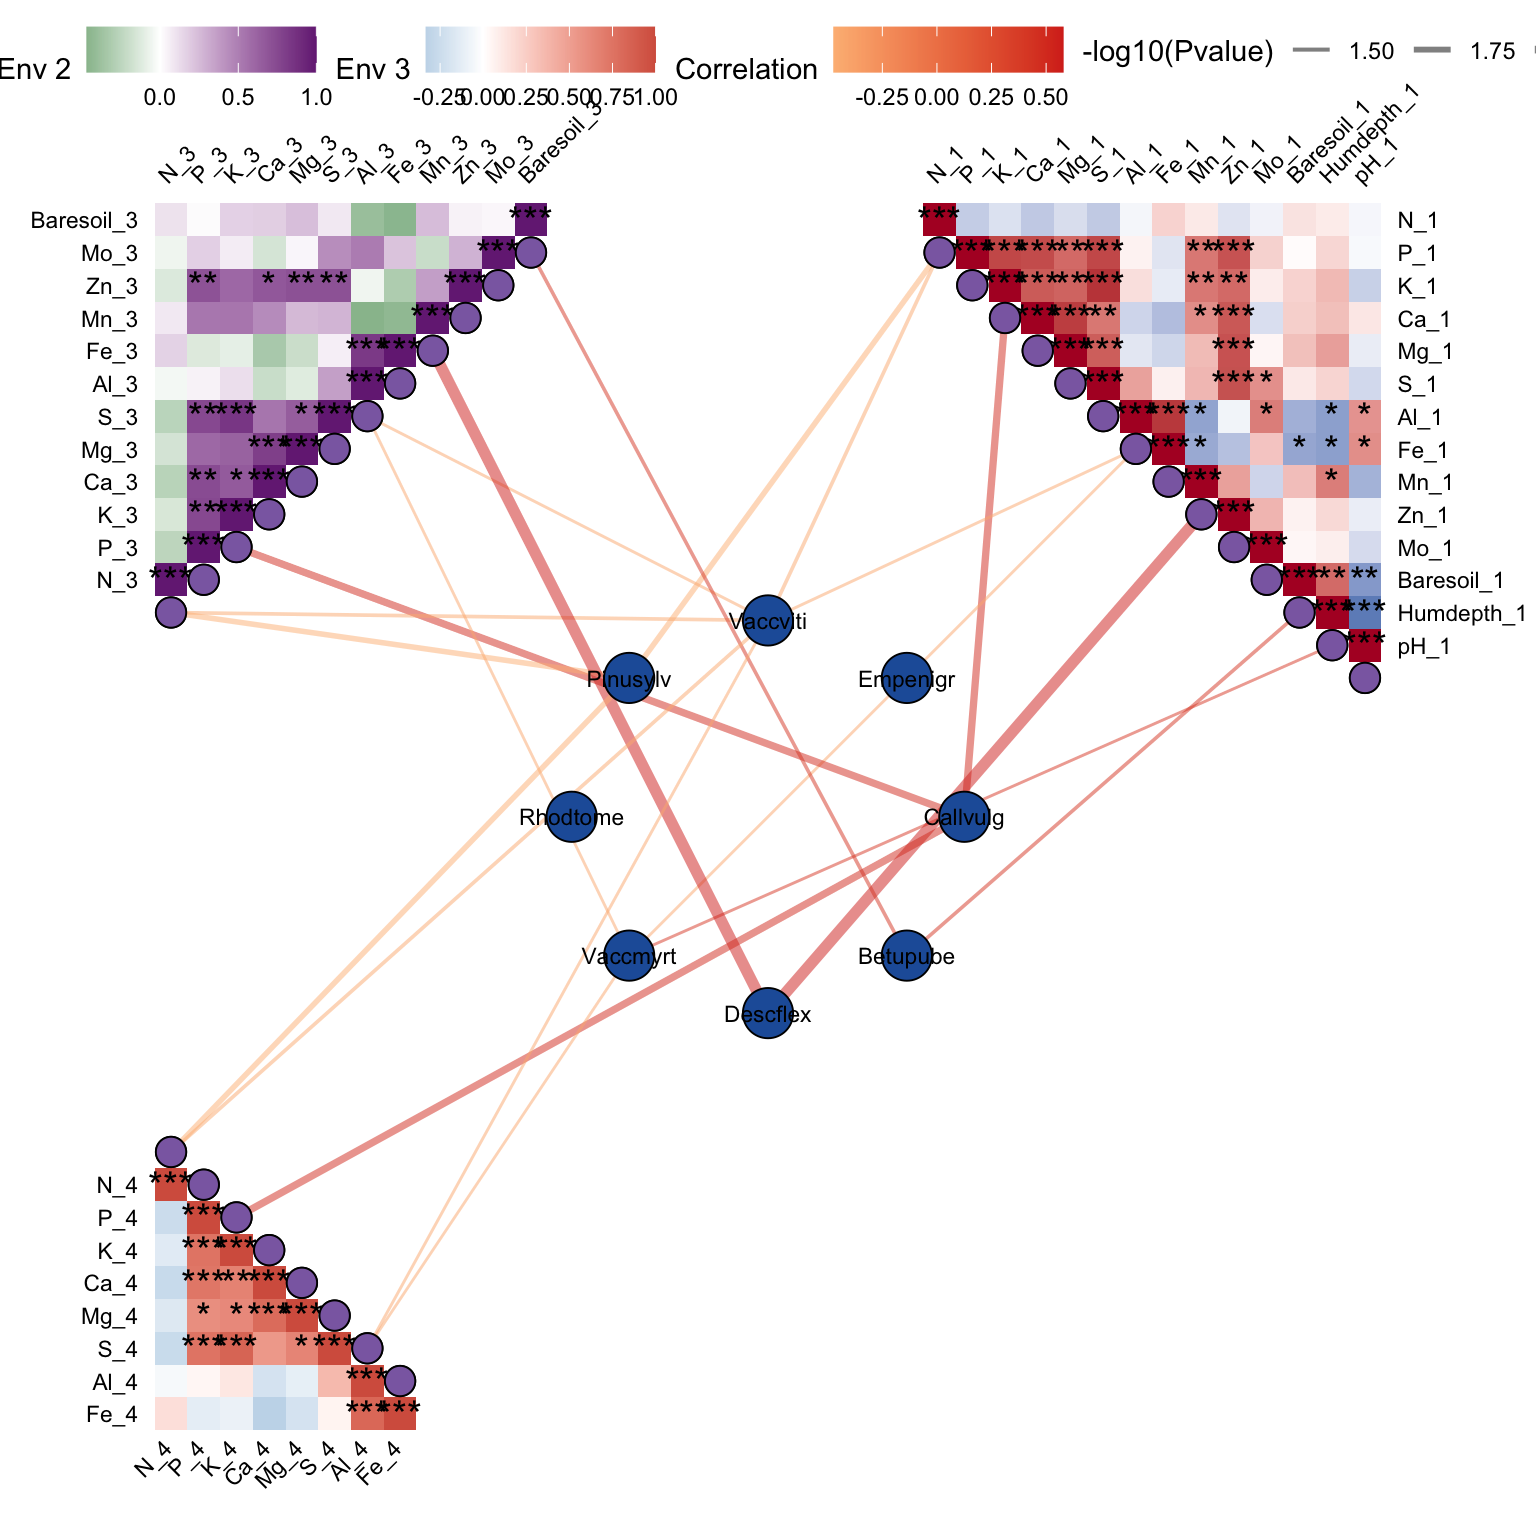
out2[[1]] # NOTE: duplicate of the line above — same plot; can be removed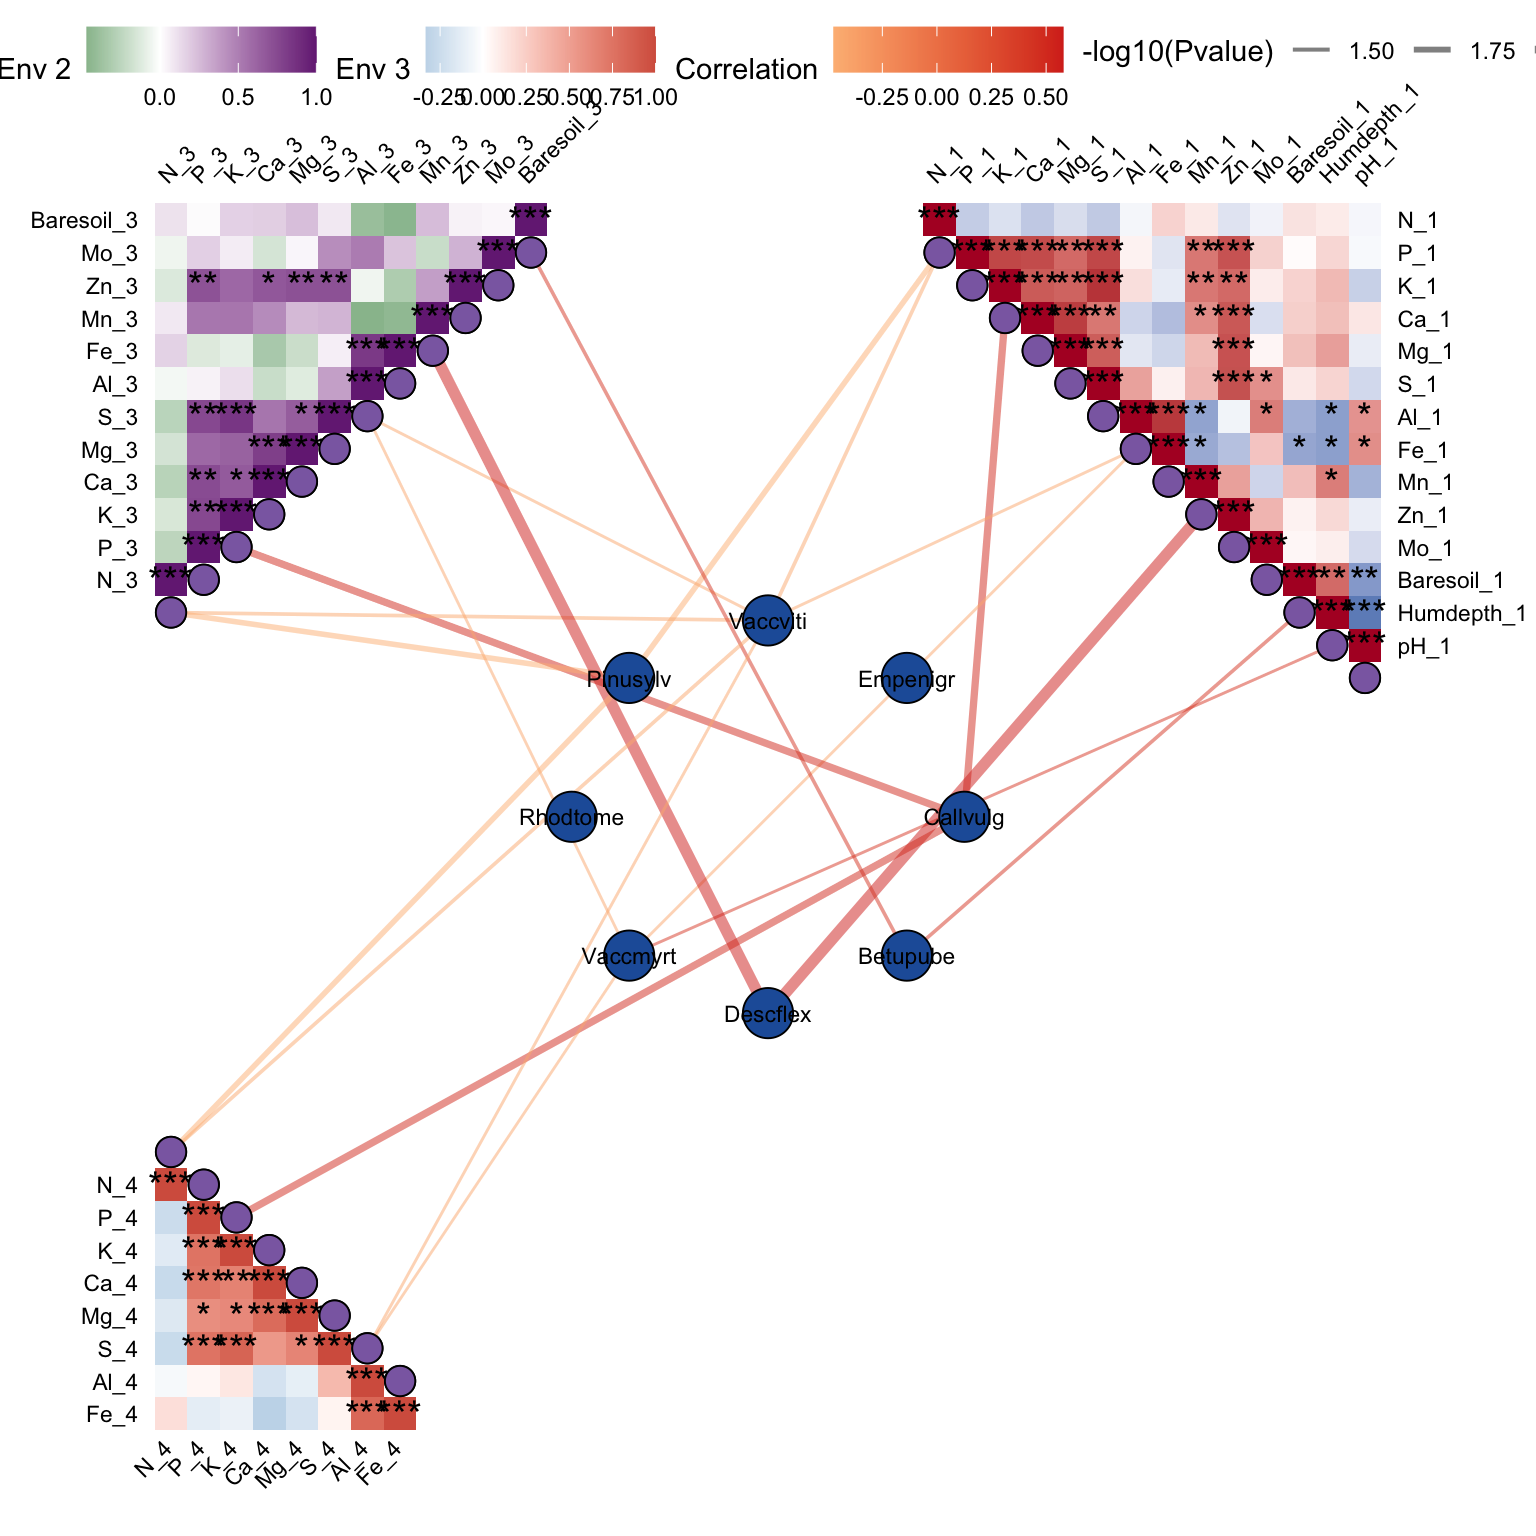
head(out2[[3]]) # the 3rd ggplot variant (different style/annotation)## ID Type Correlation Pvalue p_signif spec_block env_block
## 1 Callvulg N_1 0.194775914 0.36174639 Spec01 Env01
## 2 Callvulg P_1 -0.089825004 0.67638229 Spec01 Env01
## 3 Callvulg K_1 0.508915172 0.01109495 * Spec01 Env01
## 4 Callvulg Ca_1 0.004323521 0.98400337 Spec01 Env01
## 5 Callvulg Mg_1 0.114475972 0.59428736 Spec01 Env01
## 6 Callvulg S_1 0.401157542 0.05203489 Spec01 Env01
## method
## 1 correlation
## 2 correlation
## 3 correlation
## 4 correlation
## 5 correlation
## 6 correlation10.3 Network Environment (one core with 4 Envrionment matrix)
# ---- Plot: 1 central species block + 4 environmental heatmap quadrants ----
# `gglink_heatmaps()` puts a central species network in the middle, surrounds
# it with one env-env heatmap per "quadrant", and draws spec-env correlation
# links between the central nodes and the diagonal anchor points on each heatmap.
p0 <- gglink_heatmaps(
  env                = Envdf_4st,        # environmental table: rows = samples, cols = env factors
  spec               = Spedf,            # species table: rows = samples (same order as env), cols = species
  spec_select        = list(             # one central species network per block
    Spec01 = 1:15                        #   take species columns 1..15
  ),
  env_select         = list(             # one heatmap quadrant per env block (length must match `orientation`)
    Env01 = 1:14,
    Env02 = 15:28,
    Env03 = 29:42,
    Env04 = 43:56
  ),
  orientation        = c(                # where each env block is drawn relative to the centre
    "top_right",
    "bottom_right",
    "top_left",
    "bottom_left"
  ),
  cor.method         = "pearson",        # correlation method (Pearson / Spearman / Kendall)
  cor.use            = "pairwise",       # NA handling: pairwise-complete observations
  distance           = 0.5,              # offset between central network and the heatmaps (bigger = pushed out further)
  drop_nonsig        = T,                # hide non-significant spec-env links (still kept in the stats data)
  r                  = 4,                # effective radius of the central network
  scale_networks     = T,                # normalise each central network to the same visual radius
  group_layout       = "snake",          # anchor arrangement for multi-block centres (here only 1 block, so cosmetic)
  spec_layout        = "square_outline",    # shape of the central network: nodes on a circle outline
  anchor_dist        = 13,               # spacing between anchors
  HeatmapLabelSize   = 4,                # font size of row/column labels on heatmaps
  HeatmapSigSize     = 5,                # font size of significance marks (*, **, ***) inside heatmap tiles
  HeatmapColorBar    = list(             # one low/high colour pair per heatmap quadrant (length = # of env blocks)
    c("#2166ac", "#b2182b"),  # quadrant 1: blue -> red
    c("#1b7837", "#762a83"),  # quadrant 2: green -> purple
    c("#4393c3", "#d6604d"),  # quadrant 3: light blue -> brick
    c("#92c5de", "#f4a582")   # quadrant 4: pale blue -> peach
  ),
  HeatmapLabelOrient = 45,               # rotation angle (deg) for heatmap labels — 45 avoids overlap
  SigLineWidth       = c(1, 5),          # min/max line width for SIGNIFICANT spec-env links (mapped by strength)
  SigLineColor       = c("#9ecae1", "#fc9272"),  # colour gradient endpoints for significant links (low -> high)
  HeatmapPointSize   = 5,                # size of the diagonal anchor points where links land on each heatmap
  CorePointSize      = 10,               # size of the central species nodes
  HeatmapPointFill   = "#3690c0",        # fill colour of the heatmap diagonal anchor points
  CorePointFill      = "#e7298a"         # fill colour of the central species nodes
)
## The max module in network is 3 we use the 3 modules for next analysis
p0[[1]] # gglink_heatmaps() returns a list of ggplot variants; [[1]] = the default view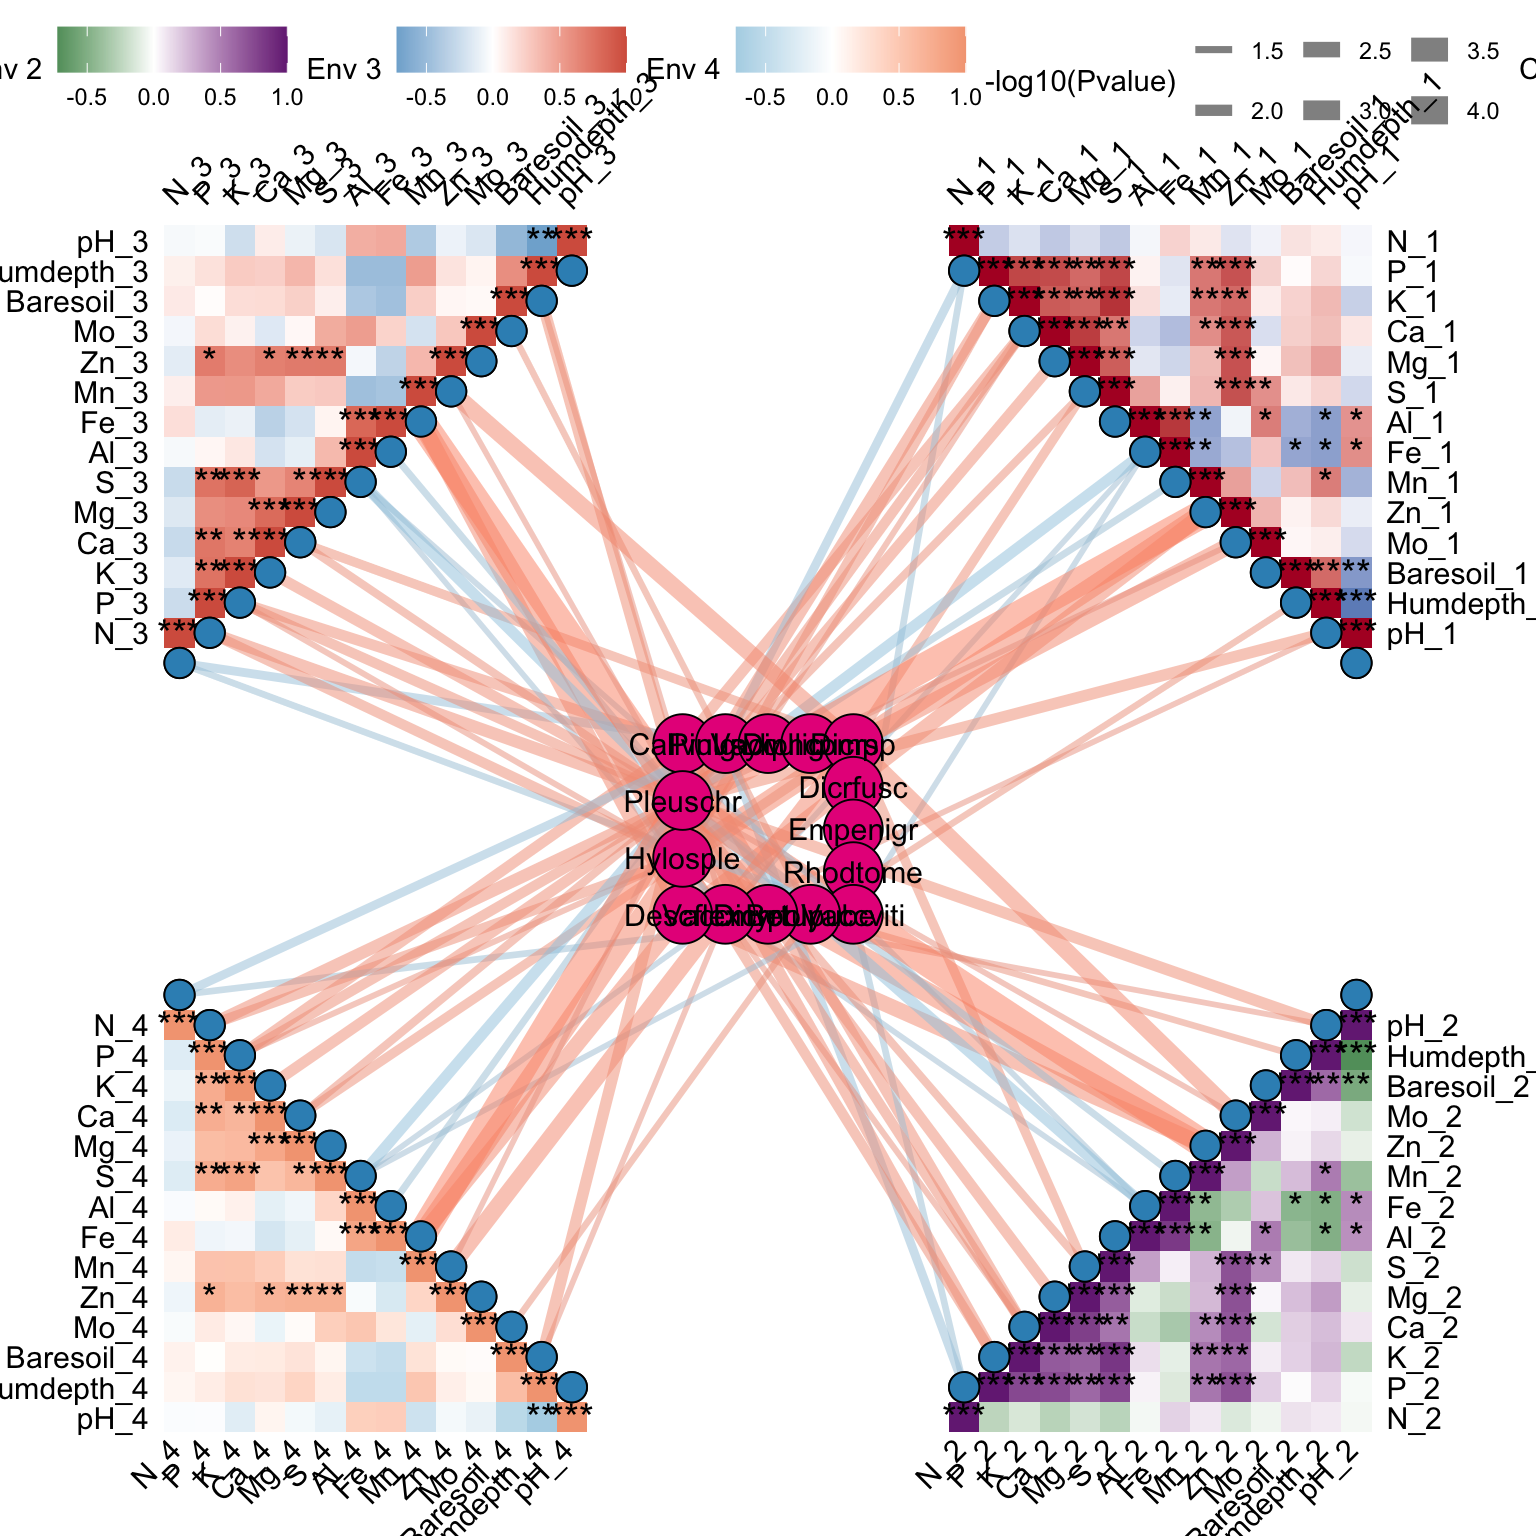
10.4 Network Environment (two core)
# ---- Plot: 2 central species blocks, each with its own layout shape ----
# `spec_select` now has 2 entries -> 2 central networks placed on the anchor frame.
# `spec_layout` gives one shape per block: first block circular outline, second square.
p <- gglink_heatmaps(
  env                = Envdf_4st,
  spec               = Spedf,
  spec_select        = list(
    Spec01 = 1:15,                       # block 1: species cols 1..15
    Spec02 = 1:15                        # block 2: same cols (demo; in real use pick a different set)
  ),
  env_select         = list(
    Env01 = 1:14,
    Env02 = 15:28,
    Env03 = 29:42,
    Env04 = 43:56
  ),
  spec_layout        = c("circle_outline", "square_outline"),  # one layout shape per spec block
  orientation        = c(
    "top_right",
    "bottom_right",
    "top_left",
    "bottom_left"
  ),
  cor.method         = "pearson",
  cor.use            = "pairwise",
  distance           = 0.5,
  drop_nonsig        = T,
  r                  = 4,
  scale_networks     = T,
  group_layout       = "snake",          # anchor arrangement for the 2 central networks
  anchor_dist        = 13,
  HeatmapLabelSize   = 4,
  HeatmapSigSize     = 5,
  HeatmapColorBar    = list(
    c("#2166ac", "#b2182b"),
    c("#1b7837", "#762a83"),
    c("#4393c3", "#d6604d"),
    c("#92c5de", "#f4a582")
  ),
  HeatmapLabelOrient = 45,
  SigLineWidth       = c(1, 5),
  SigLineColor       = c("#9ecae1", "#fc9272"),
  HeatmapPointSize   = 5,
  CorePointSize      = 10,
  HeatmapPointFill   = "#3690c0",
  CorePointFill      = "#e7298a"
)
## The max module in network is 3 we use the 3 modules for next analysis
## The max module in network is 3 we use the 3 modules for next analysis
p[[2]] # take the 2nd element from the return list (different ggplot variant)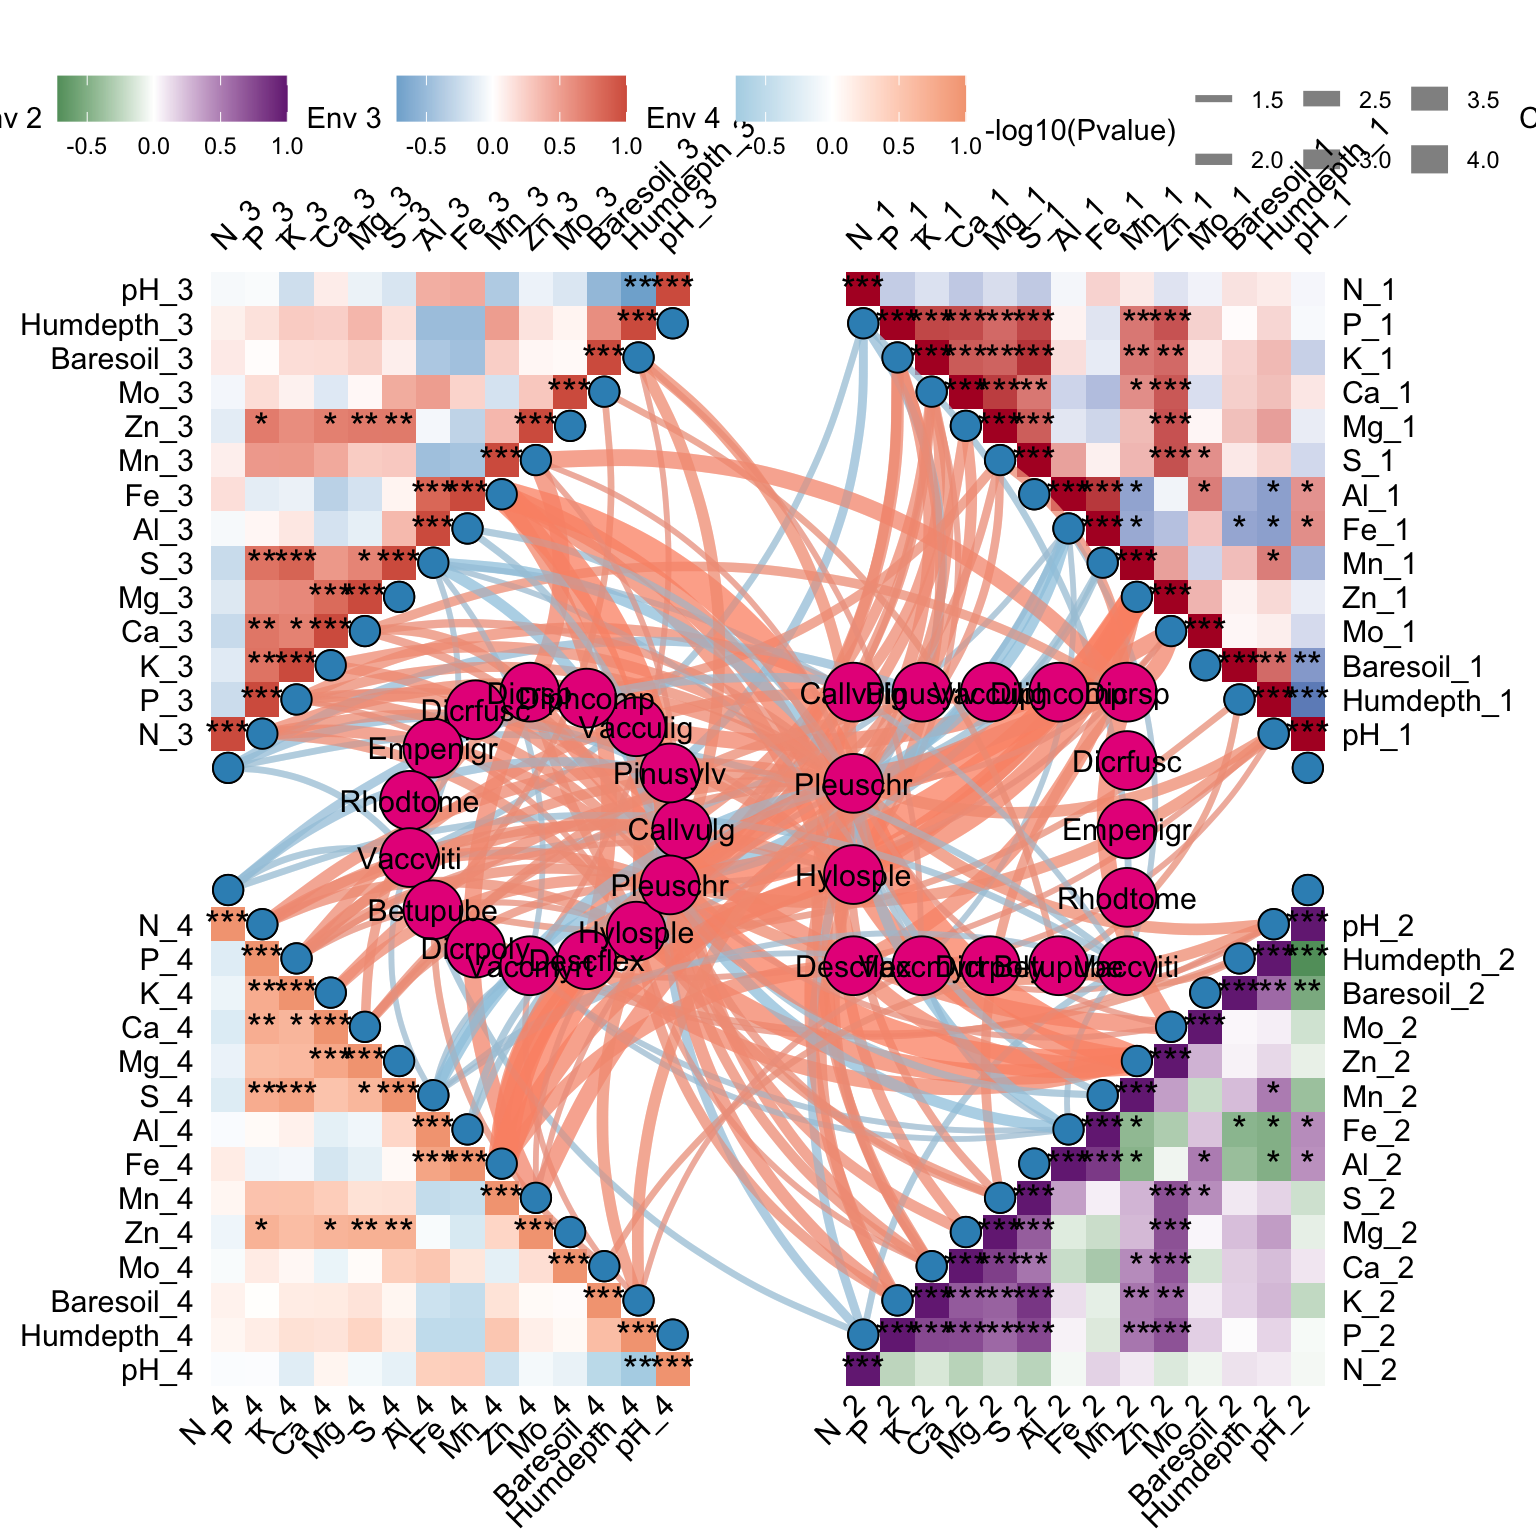
10.5 Network Environment (three core)
# ---- Plot 2: THREE central species blocks + restricted spec-env comparisons ----
# - 3 spec blocks, each with a different layout shape.
# - `comparisons_groups` restricts which (env_block, spec_block) pairs get linked
#   instead of drawing every possible combination.
# - `scale_networks = FALSE` lets the 3 blocks keep their native sizes.
p2 <- gglink_heatmaps(
  env                = Envdf_4st,
  spec               = Spedf,
  spec_select        = list(
    Spec01 = 1:15,
    Spec02 = 1:15,
    Spec03 = 16:20                       # smaller 3rd block to demo size differences
  ),
  env_select         = list(
    Env01 = 1:14,
    Env02 = 15:28,
    Env03 = 29:42,
    Env04 = 43:56
  ),
  orientation        = c(
    "top_right",
    "bottom_right",
    "top_left",
    "bottom_left"
  ),
  spec_layout        = c("rectangle_outline", "square_outline", "circle_outline"),  # one shape per spec block
  cor.method         = "pearson",
  cor.use            = "pairwise",
  distance           = 1,                # bigger gap between centre and heatmaps
  drop_nonsig        = T,
  r                  = 1.2,              # minimum block radius (because scale_networks = F, this is the floor)
  scale_networks     = F,                # do NOT normalise sizes -> blocks keep their natural scale
  anchor_dist        = 6,
  HeatmapLabelSize   = 4,
  HeatmapSigSize     = 5,
  HeatmapColorBar    = list(
    c("#2166ac", "#b2182b"),
    c("#1b7837", "#762a83"),
    c("#4393c3", "#d6604d"),
    c("#92c5de", "#f4a582")
  ),
  HeatmapLabelOrient = 45,
  SigLineWidth       = c(1, 5),
  SigLineColor       = c("#9ecae1", "#fc9272"),
  comparisons        = T,                # master switch: enable spec-env analysis + linking
  comparisons_groups = list(             # only draw links for these specific (env_block, spec_block) pairs
    c("Env01", "Spec01"),
    c("Env02", "Spec02"),
    c("Env03", "Spec03"),
    c("Env04", "Spec03")
  ),
  HeatmapPointSize   = 5,
  CorePointSize      = 10,
  HeatmapPointFill   = "#3690c0",
  CorePointFill      = "#e7298a"
)
## The max module in network is 3 we use the 3 modules for next analysis
## The max module in network is 3 we use the 3 modules for next analysis## The max module in network is 2 we use the 2 modules for next analysis
p2[[1]]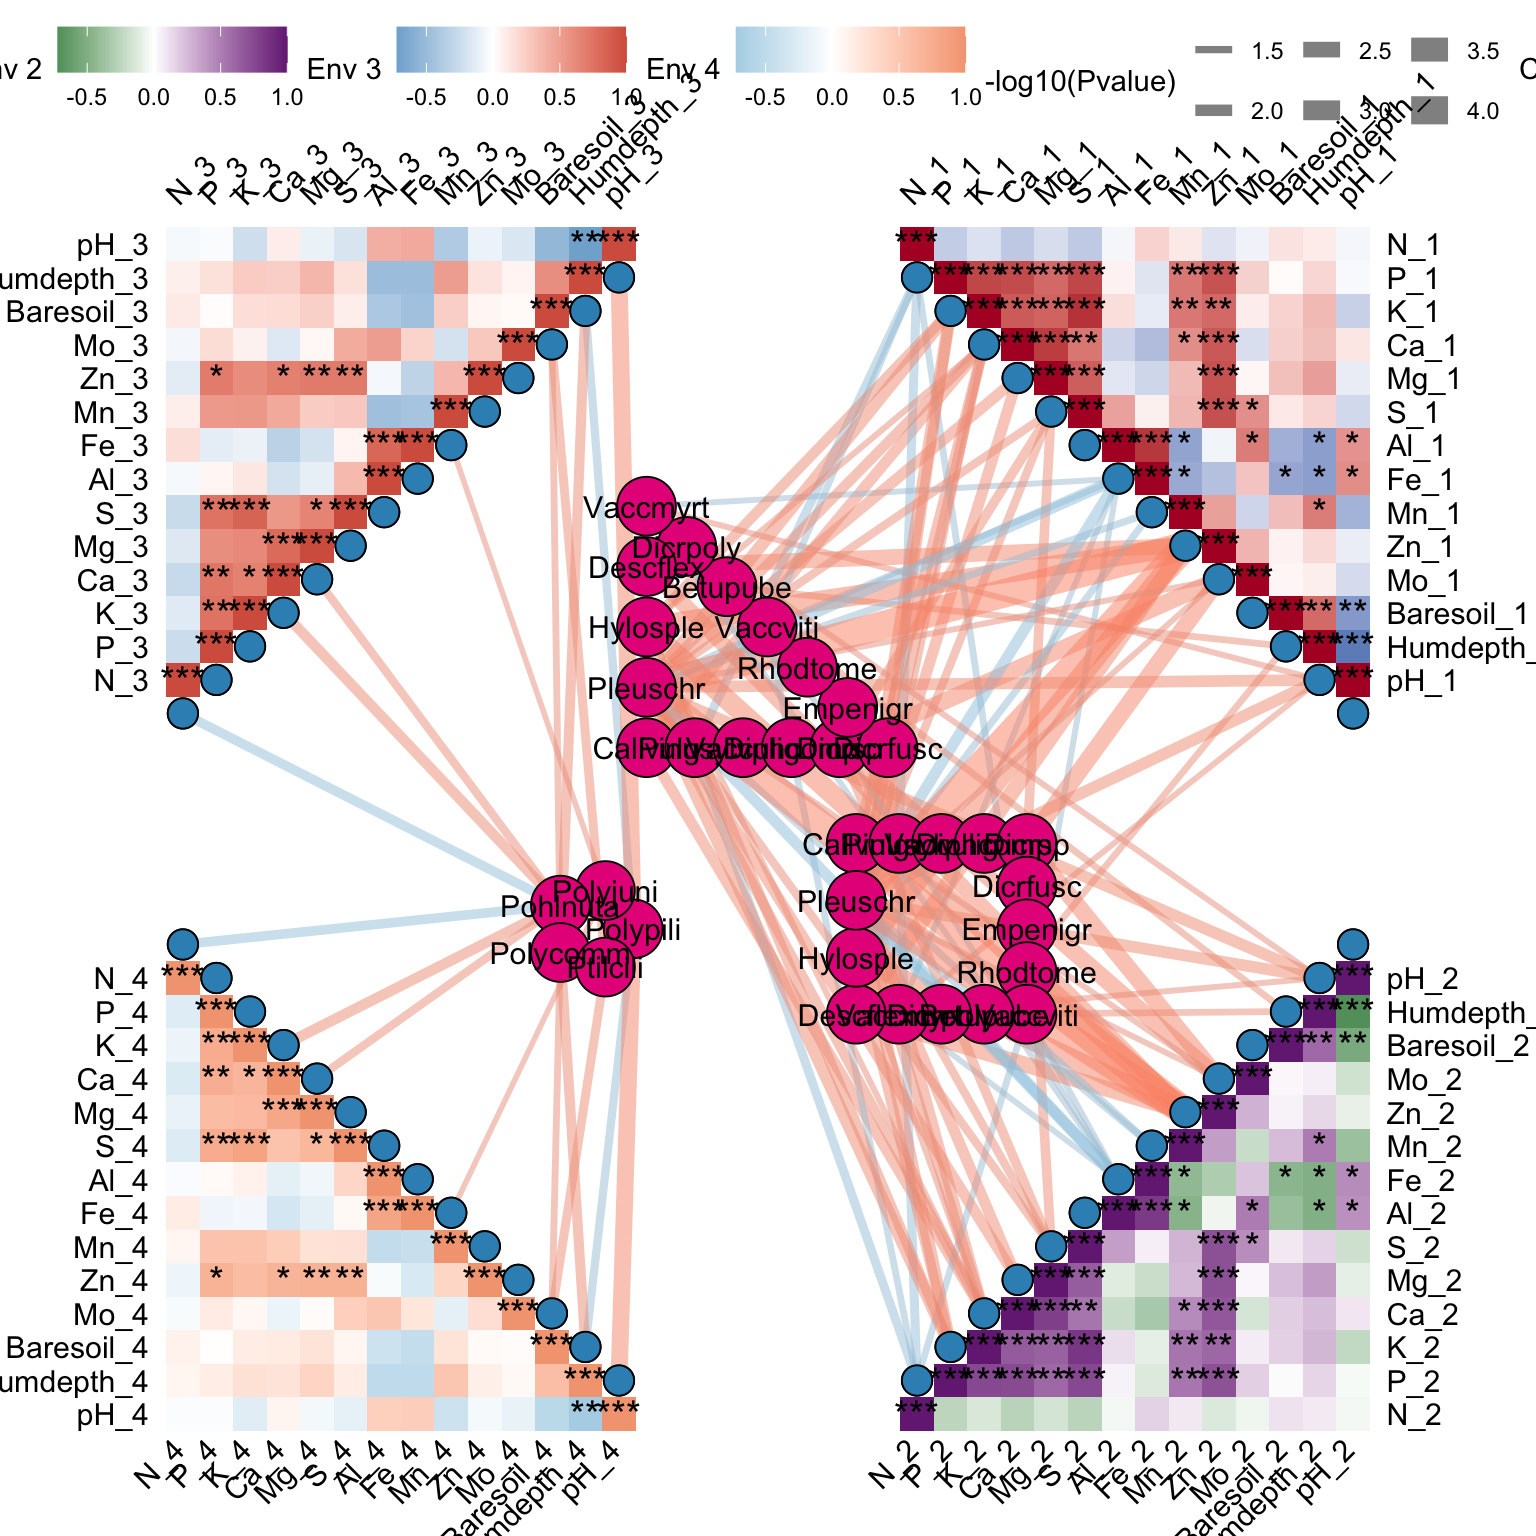
10.6 Mantel test and drop_nonsig = T
p2 <- gglink_heatmaps(
  # ---- Data input ----
  env  = Envdf_4st,                          # environmental data frame: one column per env variable
  spec = Spedf,                              # species data frame: one column per species / taxonomic unit

  # ---- Spec blocks (central networks) ----
  # Each list element defines one central species network (column indices into `spec`).
  # The block names (Spec01, Spec02 ...) are used later to match `comparisons_groups`.
  # NOTE: spec_collapse = TRUE is enabled below, so these 10 blocks are NOT drawn as
  #       networks — each one is collapsed into a single labelled point bearing the block name.
  spec_select = list(Spec01 = 1:15,
                     Spec02 = 1:15,
                     Spec03 = 16:20,
                     Spec04 = 16:20,
                     Spec05 = 16:20,
                     Spec06 = 16:20,
                     Spec07 = 5:20,
                     Spec08 = 21:25,
                     Spec09 = 26:35,
                     Spec10 = 36:44
  ),

  # ---- Collapse each spec_block into a single point ----
  # T = each spec_select element is rendered as ONE labelled point ("Spec01"..."Spec10").
  # In this mode spec_layout / spec_relation / scale_networks have no effect (no network drawn).
  # The point positions are decided by `group_layout` below.
  spec_collapse = T,

  # ---- Env blocks (the four heatmap quadrants) ----
  # Each element defines one env block; each block becomes one heatmap quadrant.
  env_select = list(Env01 = 1:14,
                    Env02 = 15:28,
                    Env03 = 29:42,
                    Env04 = 43:56),

  # ---- Orientation of the four heatmaps ----
  # Order pairs with env_select: Env01 -> top_right, Env02 -> bottom_right, etc.
  orientation = c("top_right",
                  "bottom_right",
                  "top_left",
                  "bottom_left"),

  # spec_layout = c("rectangle_outline", "square_outline", "circle_outline"),
  # ^ Node-shape layout for the central species networks; ignored when spec_collapse = T,
  #   so commenting it out makes no difference here.

  # ---- Relation method (this run uses mantel) ----
  relation_method = "mantel",                # use the mantel branch instead of correlation
  mantel.method   = "mantel",                # legacy compatibility argument; unused by the current implementation, leave as-is
  mantel_kind     = c("col_vs_col"),         # * mantel granularity:
                                             #   "col_vs_col"   = legacy mode: spec single-column dist
                                             #                    vs env single-column dist (close to rank correlation)
                                             #   "block_vs_col" = recommended ecological mode (default):
                                             #                    spec WHOLE-BLOCK dist vs single env column dist
                                             # NOTE: under col_vs_col + spec_collapse = T, every link generated
                                             #       by each spec column inside a block starts from the SAME
                                             #       collapsed point — a console message will warn about this.
  cor.method = "pearson",                    # correlation method; under mantel mode it falls through to mantel.method2; also used for env-env autocorrelation heatmaps
  cor.use    = "pairwise",                   # NA handling: pairwise-complete observations
  drop_nonsig = T,                           # T = hide non-significant links from the plot

  # ---- Central-network geometry ----
  r = 1,                                     # base radius of the central network; under spec_collapse = T only controls how tightly the points pack
  scale_networks = F,                        # F = do NOT normalise all networks to a common size;
                                             #     auto-disabled when spec_collapse = T

  # ---- Overall arrangement of the (collapsed) spec points ----
  group_layout = "circle",                   # ring layout: the 10 points are spread evenly around a circle
  # nrow = 5,                                # only used by row/column/snake layouts; no effect for circle
  anchor_dist = 8,                           # distance from each point to the centre (radius of the ring)
  distance    = 4,                           # offset between the centre point group and the outer heatmaps

  # ---- Heatmap text annotations ----
  HeatmapLabelSize  = 4,                     # font size for heatmap row/col labels (ID/Type)
  HeatmapSigSize    = 5,                     # font size for the significance marks (*, **, ***) inside heatmap tiles

  # ---- Per-quadrant colour palettes (low -> high) ----
  # Length must match `orientation` (4 quadrants); paired in order.
  HeatmapColorBar = list(
    c("#2166ac", "#b2182b"),                 # quadrant 1: top_right
    c("#1b7837", "#762a83"),                 # quadrant 2: bottom_right
    c("#4393c3", "#d6604d"),                 # quadrant 3: top_left
    c("#92c5de", "#f4a582")                  # quadrant 4: bottom_left
  ),
  HeatmapLabelOrient = 45,                   # rotate heatmap labels 45 deg to avoid overlap

  # ---- Spec-env link (segment) styling ----
  SigLineWidth = c(1, 5),                    # min / max line width for significant links (mapped by -log10(p))
  SigLineColor = c("#9ecae1", "#fc9272"),    # colour gradient endpoints for mantel r low / high

  # ---- Restrict which (env_block, spec_block) pairs are drawn ----
  # Under mantel mode, each (env_block, spec_block) pair triggers a set of mantel tests
  # (col_vs_col: |spec cols| x |env cols| tests; block_vs_col: |env cols| tests).
  comparisons = T,                           # enable the restriction (otherwise ALL possible pairs are drawn)
  comparisons_groups = list(
    c("Env01", "Spec01"),                    # Env01 paired only with Spec01
    c("Env02", "Spec02"),                    # Env02 paired only with Spec02
    c("Env03", "Spec03"),                    # Env03 paired only with Spec03
    c("Env04", "Spec03")                     # Env04 also paired only with Spec03
  ),

  # ---- Point sizes ----
  HeatmapPointSize = 4,                      # size of the anchor points on each heatmap's diagonal
  CorePointSize    = 10,                     # size of the collapsed spec points (larger than non-collapse default for visibility)

  # ---- Point fill colours (vectors are recycled in order) ----
  # HeatmapPointFill: length = # of quadrants (4), paired with `orientation` in order.
  HeatmapPointFill = c("#2166ac", "#b2182b", "#1b7837", "#762a83"),

  # CorePointFill: length = # of spec_select blocks (10), paired with names(spec_select) in order.
  # With spec_collapse = T, each block is one point, so 1 colour = 1 point.
  # First 5 points blue, last 5 points red — visually splits the 10 blocks into two groups.
  CorePointFill = c("#2166ac", "#2166ac", "#2166ac", "#2166ac",
                    "#2166ac", "#b2182b", "#b2182b", "#b2182b",
                    "#b2182b", "#b2182b")
)
## `spec_collapse = TRUE` collapses each spec block into one point; in the current mode (relation_method = 'mantel', mantel_kind = 'col_vs_col') link sources are per spec column, so all column-level links from a block will originate from the same collapsed point. Consider `relation_method = 'mantel'` + `mantel_kind = 'block_vs_col'` for a one-line-per-block visualisation.
p2[[2]] # curved-line connection version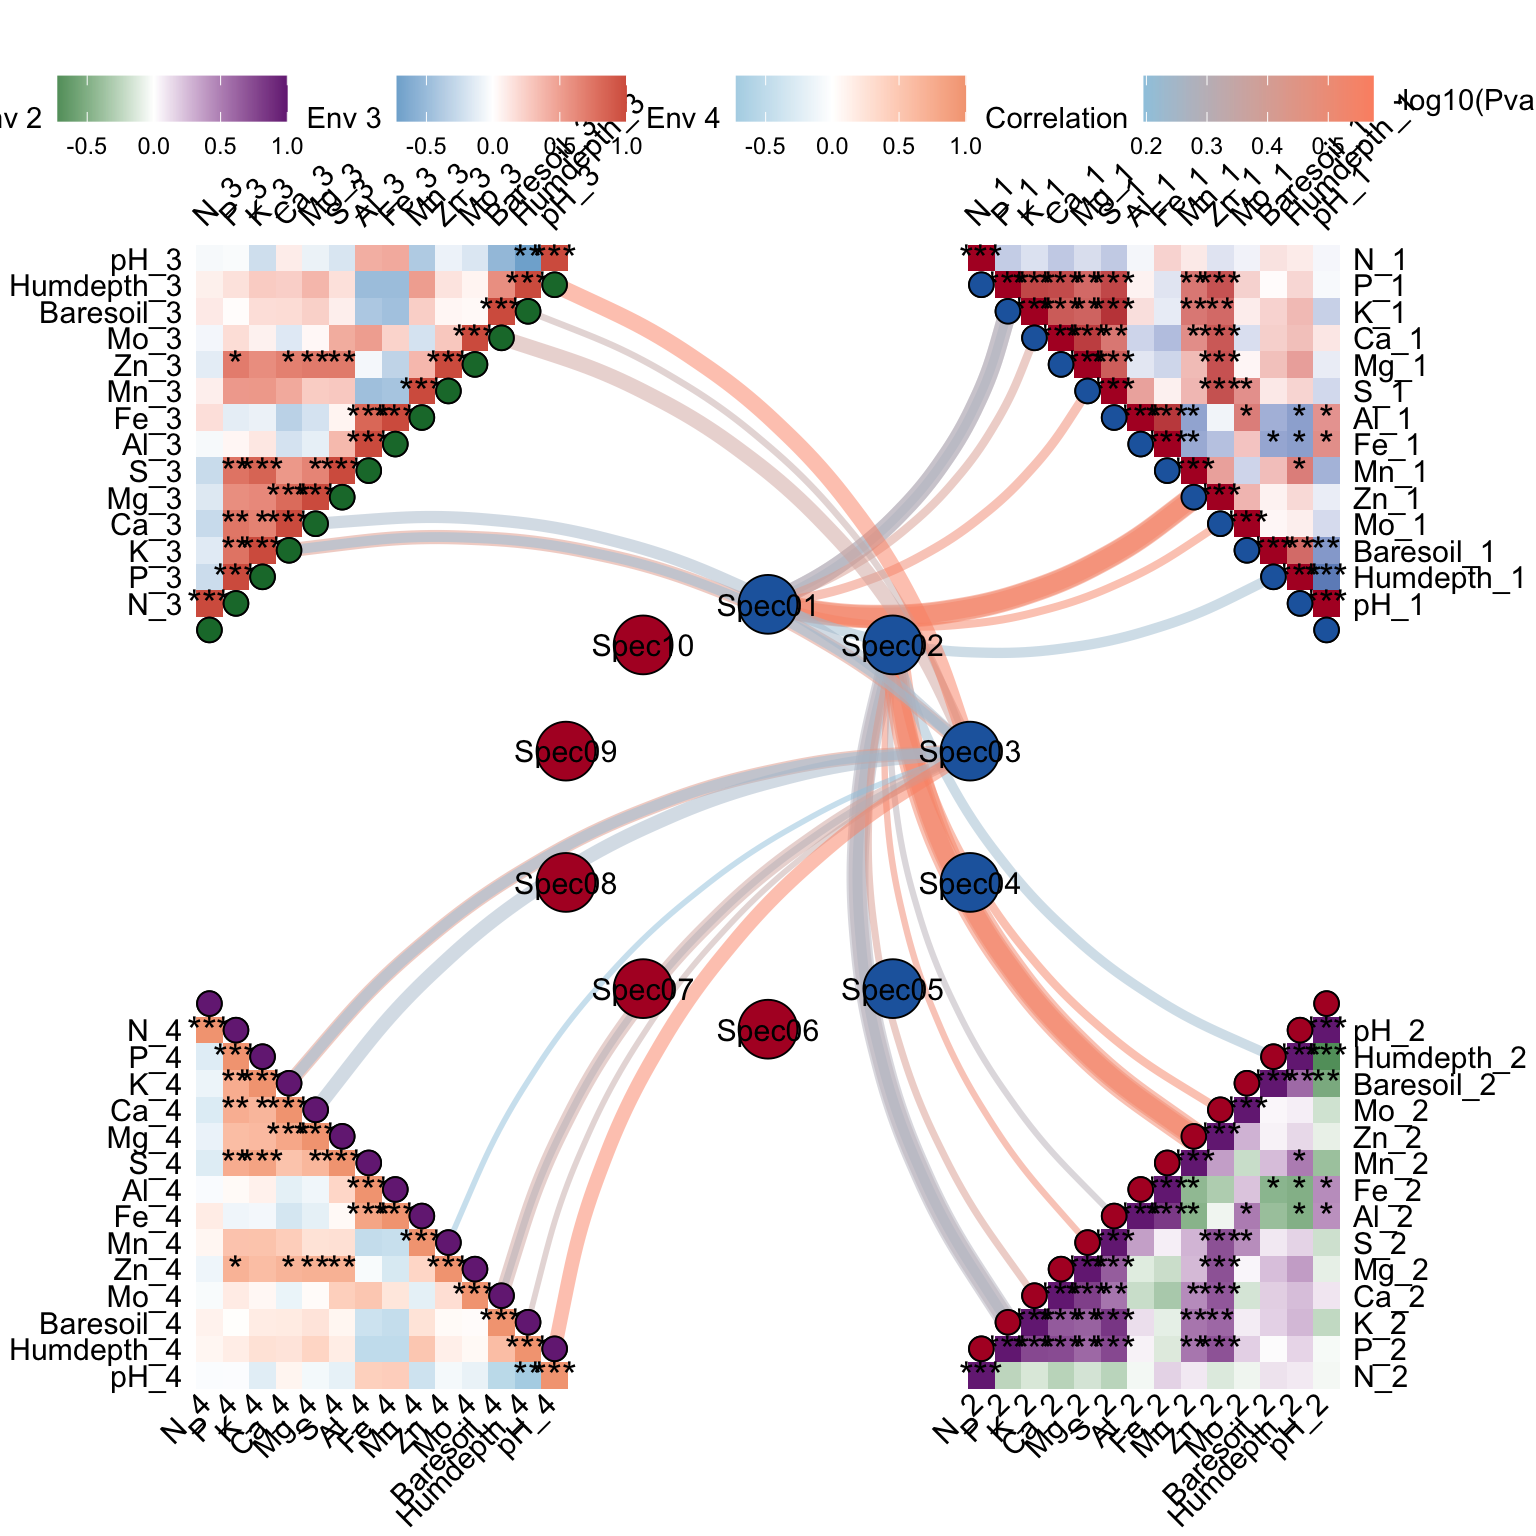
head(p2[[3]])## ID Type Correlation Pvalue spec_block env_block p_signif method
## 1 Callvulg N_1 0.01289455 0.382 Spec01 Env01 mantel
## 2 Empenigr N_1 0.01959886 0.350 Spec01 Env01 mantel
## 3 Rhodtome N_1 -0.15248826 0.893 Spec01 Env01 mantel
## 4 Vaccmyrt N_1 -0.02514002 0.528 Spec01 Env01 mantel
## 5 Vaccviti N_1 0.07366673 0.230 Spec01 Env01 mantel
## 6 Pinusylv N_1 0.12714109 0.161 Spec01 Env01 mantel10.7 Network Environment (multi-core)
p2 <- gglink_heatmaps(
  # ---- Data input ----
  env                = Envdf_4st,            # environmental data frame: one column per env variable
  spec               = Spedf,                # species data frame: one column per species / taxonomic unit

  # ---- Spec blocks (central networks) ----
  # Each list element defines one central species network (column indices into `spec`).
  # The block names (Spec01, Spec02 ...) are used later to match `comparisons_groups`.
  spec_select        = list(Spec01 = 1:15,
                            Spec02 = 1:15,
                            Spec03 = 16:20,
                            Spec04 = 16:20,
                            Spec05 = 16:20,
                            Spec06 = 16:20,
                            Spec07 = 5:20,
                            Spec08 = 21:25,
                            Spec09 = 26:35,
                            Spec10 = 36:44),

  # ---- Env blocks (the four heatmap quadrants) ----
  # Each element defines one env block; each block becomes one heatmap quadrant.
  env_select         = list(Env01 = 1:14,
                            Env02 = 15:28,
                            Env03 = 29:42,
                            Env04 = 43:56),

  # ---- Orientation of the four heatmaps ----
  # Order pairs with env_select: Env01 -> top_right, Env02 -> bottom_right, etc.
  orientation        = c("top_right",
                         "bottom_right",
                         "top_left",
                         "bottom_left"),

  # spec_layout      = c("rectangle_outline", "square_outline", "circle_outline"),
  # ^ Node-shape layout for the central species networks; commented out here, so the default "circle_outline" is used.

  # ---- Correlation parameters ----
  cor.method         = "pearson",            # correlation method: pearson / kendall / spearman
  cor.use            = "pairwise",           # NA handling: pairwise-complete observations
  drop_nonsig        = T,                    # T = hide non-significant links from the plot

  # ---- Central-network geometry ----
  r                  = 1,                    # base radius of the central network
  scale_networks     = F,                    # F = do NOT normalise all networks to a common size;
                                             #     networks with more nodes will be scaled up proportionally

  # ---- Overall arrangement of the multiple spec networks ----
  group_layout       = "snake",              # snake layout (rows zig-zag back and forth)
  nrow               = 5,                    # number of rows used by the snake layout (10 networks -> 5 rows x 2 cols)
  anchor_dist        = 8,                    # spacing between adjacent central networks
  distance           = 6,                    # offset between the central networks and the outer heatmaps

  # ---- Heatmap text annotations ----
  HeatmapLabelSize   = 4,                    # font size for heatmap row/col labels (ID/Type)
  HeatmapSigSize     = 5,                    # font size for the significance marks (*, **, ***) inside heatmap tiles

  # ---- Per-quadrant colour palettes (low -> high) ----
  # Length must match `orientation` (4 quadrants); paired in order.
  HeatmapColorBar    = list(
    c("#2166ac", "#b2182b"),                 # quadrant 1: top_right
    c("#1b7837", "#762a83"),                 # quadrant 2: bottom_right
    c("#4393c3", "#d6604d"),                 # quadrant 3: top_left
    c("#92c5de", "#f4a582")                  # quadrant 4: bottom_left
  ),
  HeatmapLabelOrient = 45,                   # rotate heatmap labels 45 deg to avoid overlap

  # ---- Spec-env link (segment) styling ----
  SigLineWidth       = c(1, 5),              # min / max line width for the links (mapped by -log10(p))
  SigLineColor       = c("#9ecae1", "#fc9272"),  # colour gradient endpoints for correlation low / high

  # ---- Restrict which (env_block, spec_block) pairs are drawn ----
  comparisons        = T,                    # enable the restriction (otherwise ALL possible pairs are drawn)
  comparisons_groups = list(
    c("Env01", "Spec01"),                    # Env01 paired only with Spec01
    c("Env02", "Spec02"),                    # Env02 paired only with Spec02
    c("Env03", "Spec03"),                    # Env03 paired only with Spec03
    c("Env04", "Spec03")                     # Env04 also paired only with Spec03
  ),

  # ---- Point sizes ----
  HeatmapPointSize   = 5,                    # size of the anchor points on each heatmap's diagonal
  CorePointSize      = 5,                    # size of the central-network nodes

  # ---- Point fill colours (vectors are recycled in order) ----
  # HeatmapPointFill: length = # of quadrants (4), paired with `orientation` in order.
  HeatmapPointFill   = c("#2166ac", "#b2182b", "#1b7837", "#762a83"),

  # CorePointFill: length = # of spec_select blocks (10), paired with names(spec_select) in order.
  # First 5 networks coloured blue, last 5 coloured red — visually splits the 10 networks into two groups.
  CorePointFill      = c("#2166ac", "#2166ac", "#2166ac", "#2166ac",
                         "#2166ac", "#b2182b", "#b2182b", "#b2182b",
                         "#b2182b", "#b2182b")
)
## The max module in network is 3 we use the 3 modules for next analysis
## The max module in network is 3 we use the 3 modules for next analysis## The max module in network is 2 we use the 2 modules for next analysis
## The max module in network is 2 we use the 2  modules for next analysis
## The max module in network is 2 we use the 2  modules for next analysis
## The max module in network is 2 we use the 2 modules for next analysis## The max module in network is 3 we use the 3 modules for next analysis## The max module in network is 2 we use the 2 modules for next analysis
## The max module in network is 2 we use the 2 modules for next analysis## The max module in network is 3 we use the 3 modules for next analysis
p2[[1]] # take the 1st element: the straight-line version of the plot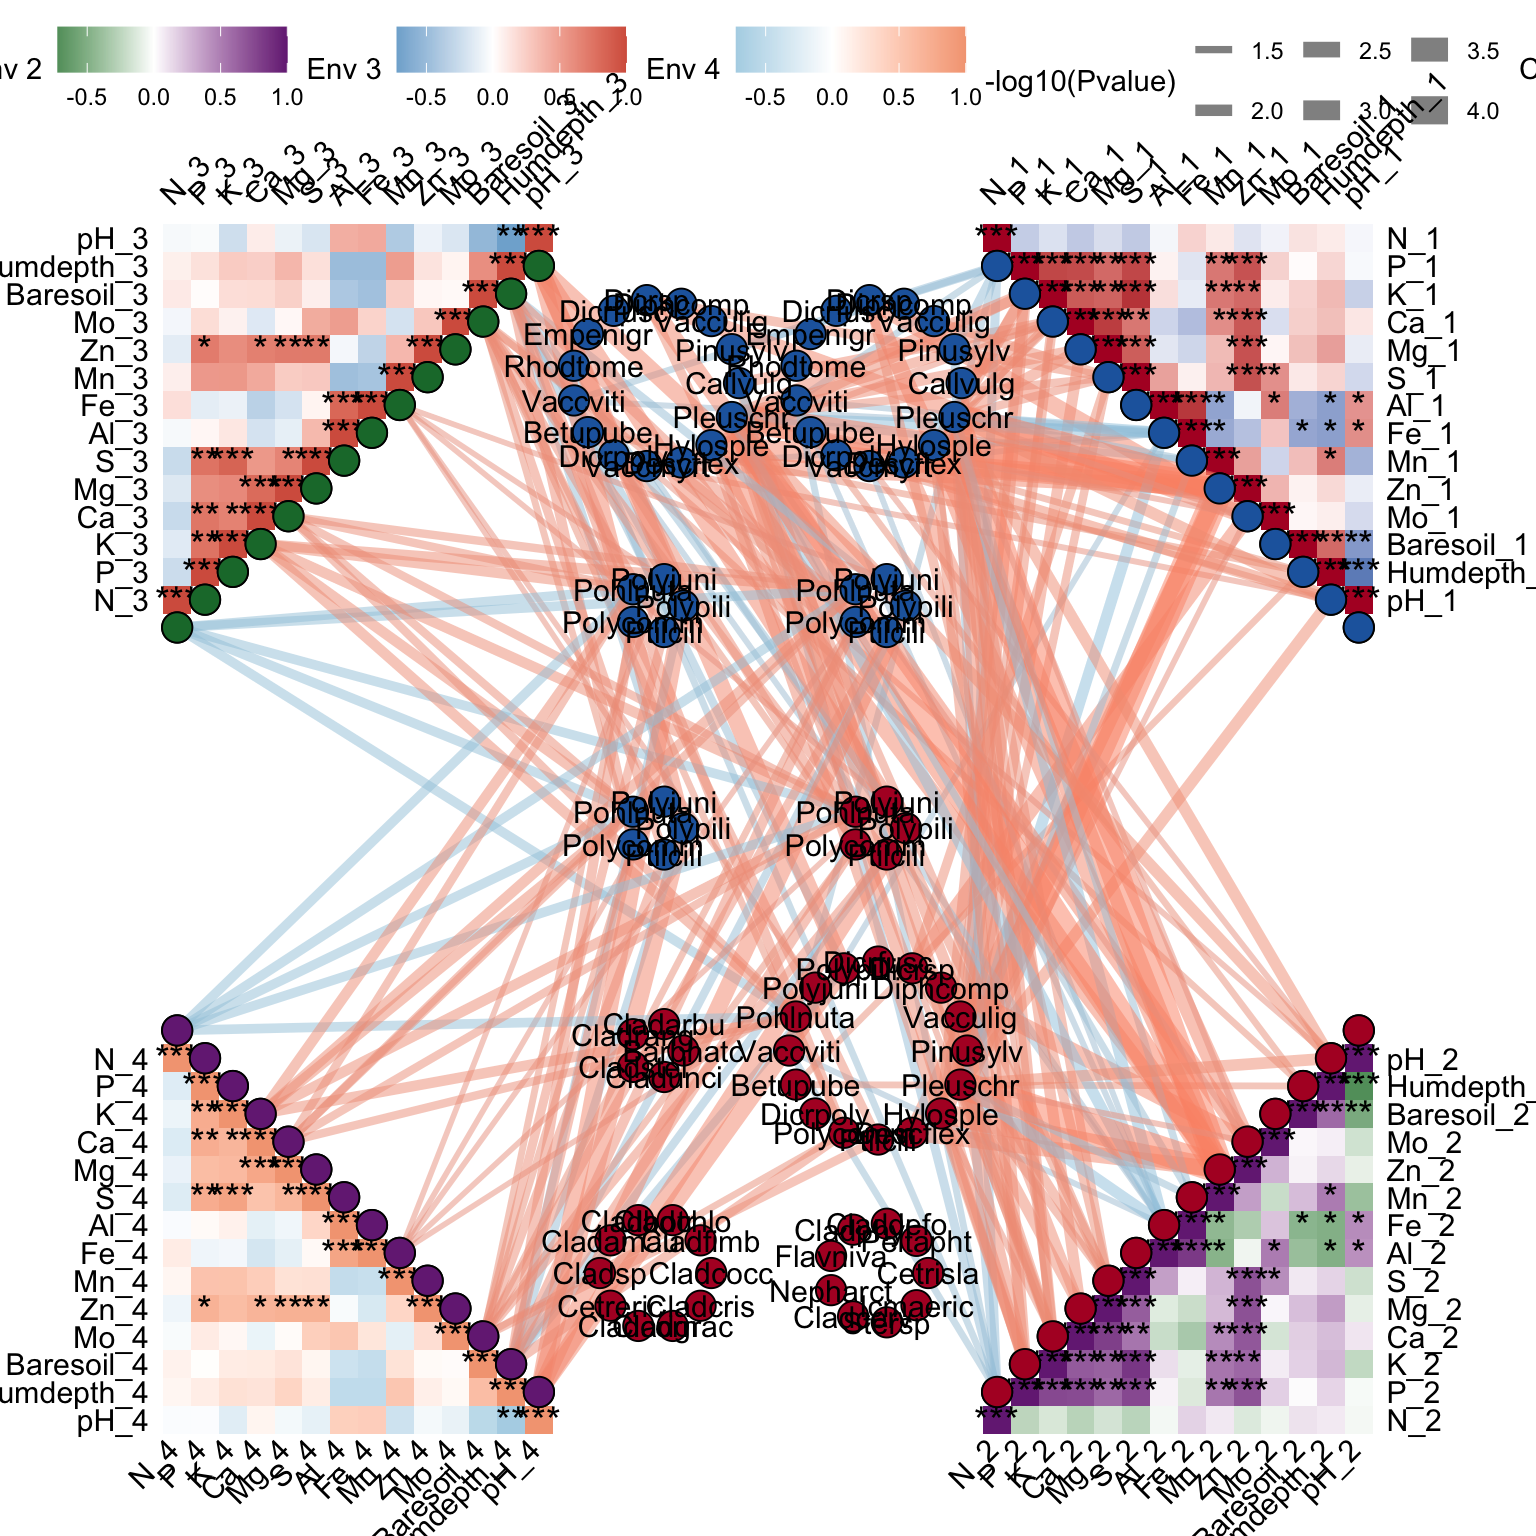
10.8 Network Environment (combine-core to one point)
p2 <- gglink_heatmaps(
  # ---- Data input ----
  env                = Envdf_4st,            # environmental data frame: one column per env variable
  spec               = Spedf,                # species data frame: one column per species / taxonomic unit

  # ---- Spec blocks (central networks) ----
  # Each list element defines one central species network (column indices into `spec`).
  # The block names (Spec01, Spec02 ...) are used later to match `comparisons_groups`.
  # NOTE: spec_collapse = TRUE is enabled below, so these 6 blocks are NOT drawn as
  #       networks — each one is collapsed into a single labelled point bearing the block name.
  spec_select        = list(Spec01 = 1:10,
                            Spec02 = 11:20,
                            Spec03 = 5:21,
                            Spec04 = 20:26,
                            Spec05 = 30:40,
                            Spec06 = 25:44),

  # ---- Collapse each spec_block into a single point ----
  # T = each spec_select element is rendered as ONE labelled point ("Spec01"..."Spec06").
  # In this mode spec_layout / spec_relation / scale_networks have no effect (no network drawn).
  # The point positions are decided by `group_layout` below.
  spec_collapse      = T,

  # ---- Env blocks (the four heatmap quadrants) ----
  # Each element defines one env block; each block becomes one heatmap quadrant.
  env_select         = list(Env01 = 1:14,
                            Env02 = 15:28,
                            Env03 = 29:42,
                            Env04 = 43:56),

  # ---- Orientation of the four heatmaps ----
  # Order pairs with env_select: Env01 -> top_right, Env02 -> bottom_right, etc.
  orientation        = c("top_right",
                         "bottom_right",
                         "top_left",
                         "bottom_left"),

  # spec_layout      = c("rectangle_outline", "square_outline", "circle_outline"),
  # ^ Node-shape layout for the central species networks; ignored when spec_collapse = T,
  #   so commenting it out makes no difference here.

  # ---- Relation method (this run uses mantel) ----
  relation_method    = "mantel",             # use the mantel branch instead of correlation
  mantel.method      = "mantel",             # legacy compatibility argument; unused by the current implementation, leave as-is
  mantel_kind        = c("col_vs_col"),      # * mantel granularity:
                                             #   "col_vs_col"   = legacy mode: spec single-column dist
                                             #                    vs env single-column dist (close to rank correlation)
                                             #   "block_vs_col" = recommended ecological mode (default):
                                             #                    spec WHOLE-BLOCK dist vs single env column dist
                                             # NOTE: under col_vs_col + spec_collapse = T, every link generated
                                             #       by each spec column inside a block starts from the SAME
                                             #       collapsed point — a console message will warn about this.
  cor.method         = "pearson",            # correlation method; under mantel mode it falls through to mantel.method2; also used for env-env autocorrelation heatmaps
  cor.use            = "pairwise",           # NA handling: pairwise-complete observations
  drop_nonsig        = T,                    # T = hide non-significant links from the plot

  # ---- Central-network geometry ----
  r                  = 0.1,                  # base radius of the central network; under spec_collapse = T only controls how tightly the points pack
  scale_networks     = F,                    # F = do NOT normalise all networks to a common size;
                                             #     auto-disabled when spec_collapse = T

  # ---- Overall arrangement of the (collapsed) spec points ----
  group_layout       = "row",                # row layout: points are placed along a horizontal row
  group_angle        = 45,                   # rotate the whole point row by 45 deg around the centre
  # nrow             = 5,                    # only used by row/column/snake when wrapping into multiple rows; not needed here
  anchor_dist        = 4,                    # spacing between adjacent points along the row
  distance           = -3,                   # offset between the centre point group and the outer heatmaps (negative -> pull heatmaps INWARD, toward the centre)

  # ---- Heatmap text annotations ----
  HeatmapLabelSize   = 4,                    # font size for heatmap row/col labels (ID/Type)
  HeatmapSigSize     = 5,                    # font size for the significance marks (*, **, ***) inside heatmap tiles

  # ---- Per-quadrant colour palettes (low -> high) ----
  # Length must match `orientation` (4 quadrants); paired in order.
  HeatmapColorBar    = list(
    c("#2166ac", "#b2182b"),                 # quadrant 1: top_right
    c("#1b7837", "#762a83"),                 # quadrant 2: bottom_right
    c("#4393c3", "#d6604d"),                 # quadrant 3: top_left
    c("#92c5de", "#f4a582")                  # quadrant 4: bottom_left
  ),
  HeatmapLabelOrient = 45,                   # rotate heatmap labels 45 deg to avoid overlap

  # ---- Spec-env link (segment) styling ----
  SigLineWidth       = c(1, 5),              # min / max line width for the links (mapped by -log10(p))
  SigLineColor       = c("#9ecae1", "#fc9272"),  # colour gradient endpoints for mantel r low / high

  # ---- Restrict which (env_block, spec_block) pairs are drawn ----
  # Under mantel mode, each (env_block, spec_block) pair triggers a set of mantel tests
  # (col_vs_col: |spec cols| x |env cols| tests; block_vs_col: |env cols| tests).
  comparisons        = T,                    # enable the restriction (otherwise ALL possible pairs are drawn)
  comparisons_groups = list(
    c("Env01", "Spec01"),                    # Env01 paired only with Spec01
    c("Env02", "Spec02"),                    # Env02 paired only with Spec02
    c("Env03", "Spec03"),                    # Env03 paired only with Spec03
    c("Env04", "Spec03")                     # Env04 also paired only with Spec03
  ),

  # ---- Point sizes ----
  HeatmapPointSize   = 4,                    # size of the anchor points on each heatmap's diagonal
  CorePointSize      = 10,                   # size of the collapsed spec points (larger than non-collapse default for visibility)

  # ---- Point fill colours (vectors are recycled in order) ----
  # HeatmapPointFill: length = # of quadrants (4), paired with `orientation` in order.
  HeatmapPointFill   = c("#2166ac", "#b2182b", "#1b7837", "#762a83"),

  # CorePointFill: length = # of spec_select blocks (6), paired with names(spec_select) in order.
  # With spec_collapse = T, each block is one point, so 1 colour = 1 point.
  # Six distinct colours here, one per Spec01..Spec06 — visually distinguishes every block.
  CorePointFill      = c("#2166ac", "#b2182b", "#1b7837",
                         "#762a83", "#9ecae1", "#fc9272")
)
## `spec_collapse = TRUE` collapses each spec block into one point; in the current mode (relation_method = 'mantel', mantel_kind = 'col_vs_col') link sources are per spec column, so all column-level links from a block will originate from the same collapsed point. Consider `relation_method = 'mantel'` + `mantel_kind = 'block_vs_col'` for a one-line-per-block visualisation.## `distance = -3` is negative; the env heatmaps will be pulled inward and may overlap the central point group. If a heatmap anchor becomes <= 0 you will get a warning and the corresponding heatmap may flip to the opposite side -- use a less negative value if that happens.
p2[[1]]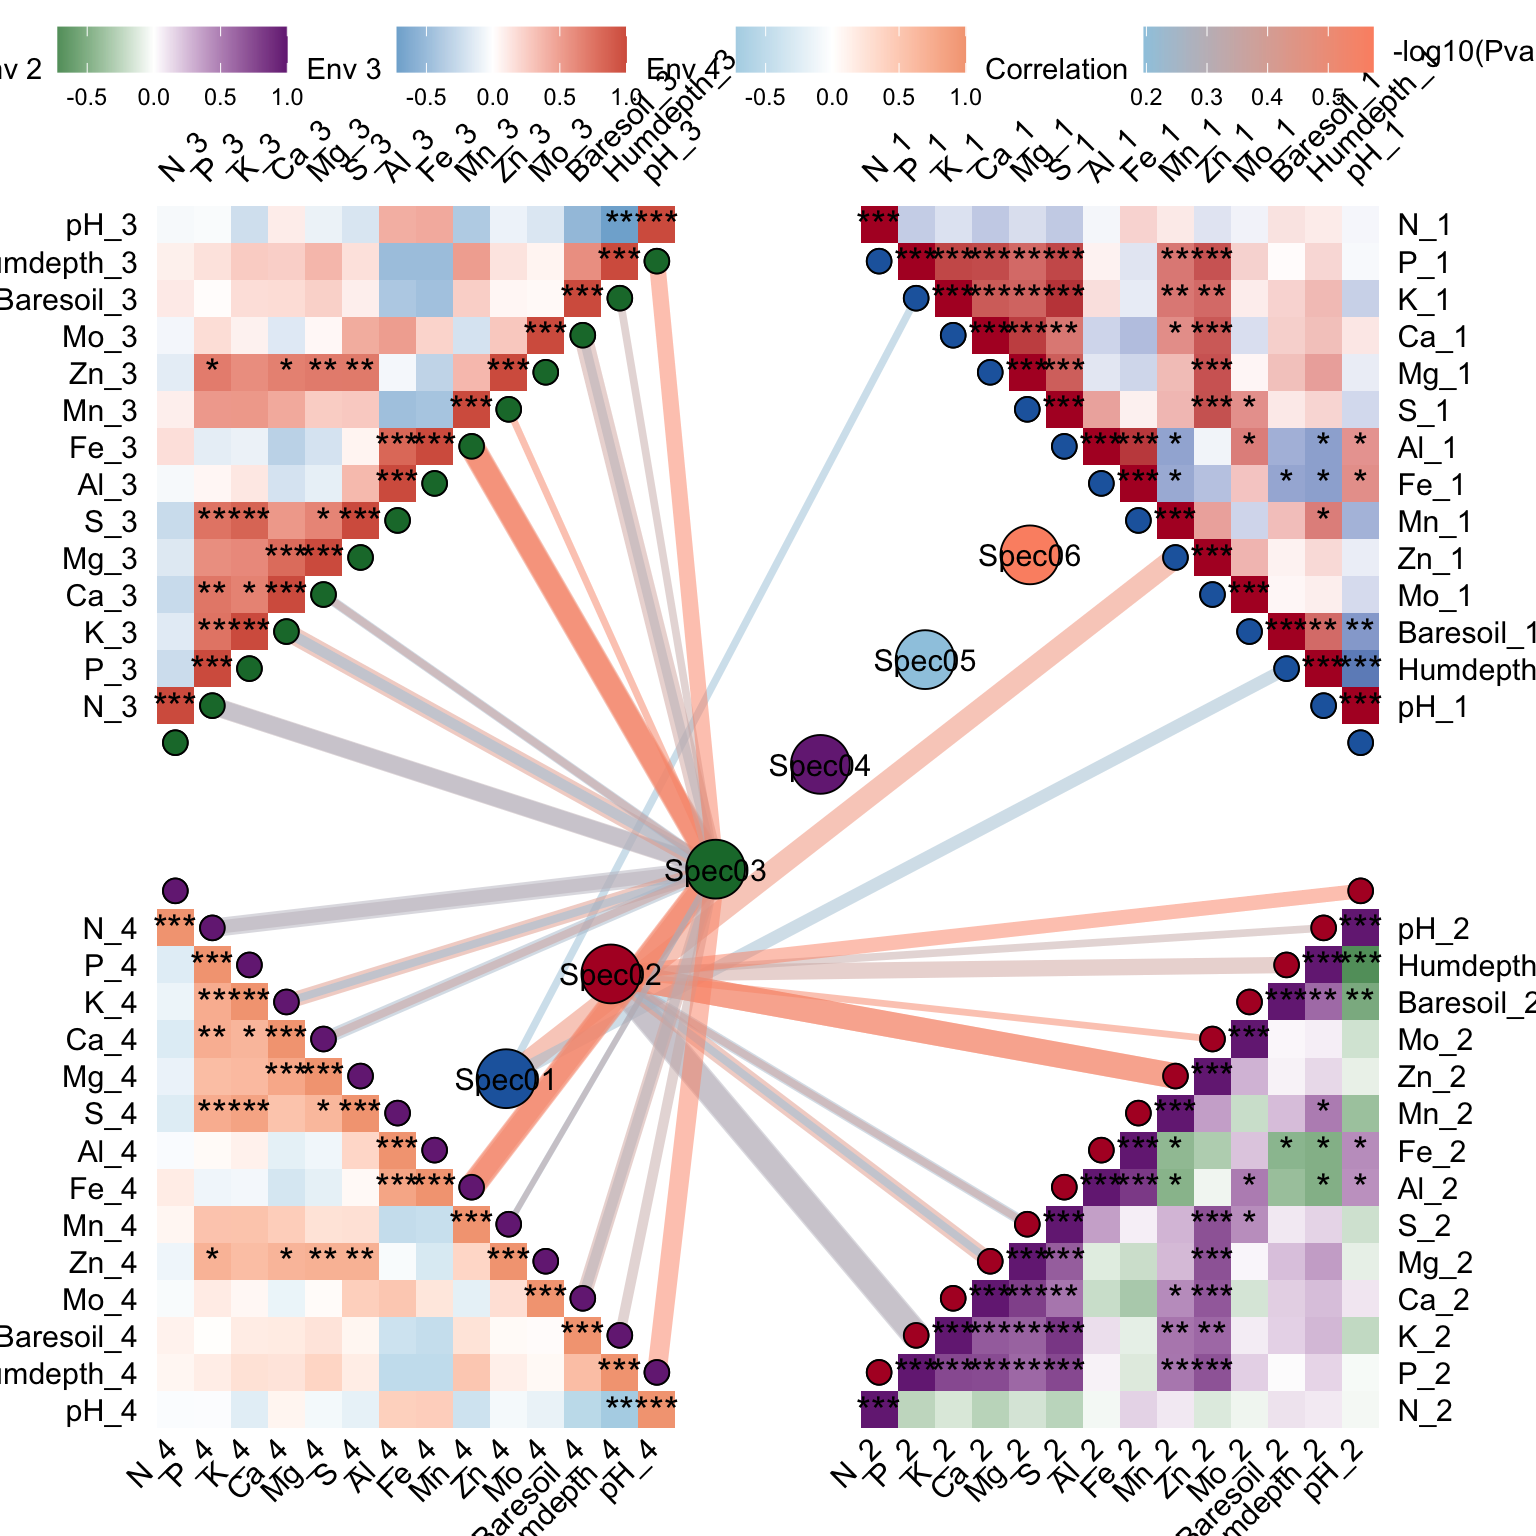
10.9 Change group angle
p3 <- gglink_heatmaps(
  # ---- Data input ----
  env                = Envdf_4st,            # environmental data frame: one column per env variable
  spec               = Spedf,                # species data frame: one column per species / taxonomic unit

  # ---- Spec blocks (central networks) ----
  # Each list element defines one central species network (column indices into `spec`).
  # The block names (Spec01, Spec02 ...) are used later to match `comparisons_groups`.
  # NOTE: spec_collapse = TRUE is enabled below, so these 6 blocks are NOT drawn as
  #       networks — each one is collapsed into a single labelled point bearing the block name.
  spec_select        = list(Spec01 = 1:10,
                            Spec02 = 11:20,
                            Spec03 = 5:21,
                            Spec04 = 20:26,
                            Spec05 = 30:40,
                            Spec06 = 25:44),

  # ---- Collapse each spec_block into a single point ----
  # T = each spec_select element is rendered as ONE labelled point ("Spec01"..."Spec06").
  # In this mode spec_layout / spec_relation / scale_networks have no effect (no network drawn).
  # The point positions are decided by `group_layout` below.
  spec_collapse      = T,

  # ---- Env blocks (the four heatmap quadrants) ----
  # Each element defines one env block; each block becomes one heatmap quadrant.
  env_select         = list(Env01 = 1:14,
                            Env02 = 15:28,
                            Env03 = 29:42,
                            Env04 = 43:56),

  # ---- Orientation of the four heatmaps ----
  # Order pairs with env_select: Env01 -> top_right, Env02 -> bottom_right, etc.
  orientation        = c("top_right",
                         "bottom_right",
                         "top_left",
                         "bottom_left"),

  # spec_layout      = c("rectangle_outline", "square_outline", "circle_outline"),
  # ^ Node-shape layout for the central species networks; ignored when spec_collapse = T,
  #   so commenting it out makes no difference here.

  # ---- Relation method (this run uses mantel) ----
  relation_method    = "mantel",             # use the mantel branch instead of correlation
  mantel.method      = "mantel",             # legacy compatibility argument; unused by the current implementation, leave as-is
  mantel_kind        = c("col_vs_col"),      # * mantel granularity:
                                             #   "col_vs_col"   = legacy mode: spec single-column dist
                                             #                    vs env single-column dist (close to rank correlation)
                                             #   "block_vs_col" = recommended ecological mode (default):
                                             #                    spec WHOLE-BLOCK dist vs single env column dist
                                             # NOTE: under col_vs_col + spec_collapse = T, every link generated
                                             #       by each spec column inside a block starts from the SAME
                                             #       collapsed point — a console message will warn about this.
  cor.method         = "pearson",            # correlation method; under mantel mode it falls through to mantel.method2; also used for env-env autocorrelation heatmaps
  cor.use            = "pairwise",           # NA handling: pairwise-complete observations
  drop_nonsig        = T,                    # T = hide non-significant links from the plot

  # ---- Central-network geometry ----
  r                  = 0.1,                  # base radius of the central network; under spec_collapse = T only controls how tightly the points pack
  scale_networks     = F,                    # F = do NOT normalise all networks to a common size;
                                             #     auto-disabled when spec_collapse = T

  # ---- Overall arrangement of the (collapsed) spec points ----
  group_layout       = "arc",                # arc layout: points are spread along an ARC (a partial circle, not a full ring)
  group_angle        = 45,                   # rotate the whole arc by 45 deg around the centre (starting angle)
  group_arc_angle    = 90,                   # angular span of the arc in degrees: 90 = quarter circle, 180 = half circle, 360 = full ring
  # nrow             = 5,                    # only used by row/column/snake when wrapping into multiple rows; not needed here
  anchor_dist        = 4,                    # distance from each point to the centre (radius of the arc)
  distance           = -3,                   # offset between the centre point group and the outer heatmaps (negative -> pull heatmaps INWARD, toward the centre)

  # ---- Heatmap text annotations ----
  HeatmapLabelSize   = 4,                    # font size for heatmap row/col labels (ID/Type)
  HeatmapSigSize     = 5,                    # font size for the significance marks (*, **, ***) inside heatmap tiles

  # ---- Per-quadrant colour palettes (low -> high) ----
  # Length must match `orientation` (4 quadrants); paired in order.
  HeatmapColorBar    = list(
    c("#2166ac", "#b2182b"),                 # quadrant 1: top_right
    c("#1b7837", "#762a83"),                 # quadrant 2: bottom_right
    c("#4393c3", "#d6604d"),                 # quadrant 3: top_left
    c("#92c5de", "#f4a582")                  # quadrant 4: bottom_left
  ),
  HeatmapLabelOrient = 45,                   # rotate heatmap labels 45 deg to avoid overlap

  # ---- Spec-env link (segment) styling ----
  SigLineWidth       = c(1, 5),              # min / max line width for the links (mapped by -log10(p))
  SigLineColor       = c("#9ecae1", "#fc9272"),  # colour gradient endpoints for mantel r low / high

  # ---- Restrict which (env_block, spec_block) pairs are drawn ----
  # Under mantel mode, each (env_block, spec_block) pair triggers a set of mantel tests
  # (col_vs_col: |spec cols| x |env cols| tests; block_vs_col: |env cols| tests).
  comparisons        = T,                    # enable the restriction (otherwise ALL possible pairs are drawn)
  comparisons_groups = list(
    c("Env01", "Spec01"),                    # Env01 paired only with Spec01
    c("Env02", "Spec02"),                    # Env02 paired only with Spec02
    c("Env03", "Spec03"),                    # Env03 paired only with Spec03
    c("Env04", "Spec03")                     # Env04 also paired only with Spec03
  ),

  # ---- Point sizes ----
  HeatmapPointSize   = 4,                    # size of the anchor points on each heatmap's diagonal
  CorePointSize      = 10,                   # size of the collapsed spec points (larger than non-collapse default for visibility)

  # ---- Point fill colours (vectors are recycled in order) ----
  # HeatmapPointFill: length = # of quadrants (4), paired with `orientation` in order.
  HeatmapPointFill   = c("#2166ac", "#b2182b", "#1b7837", "#762a83"),

  # CorePointFill: length = # of spec_select blocks (6), paired with names(spec_select) in order.
  # With spec_collapse = T, each block is one point, so 1 colour = 1 point.
  # Six distinct colours, one per Spec01..Spec06 — visually distinguishes every block.
  CorePointFill      = c("#2166ac", "#b2182b", "#1b7837",
                         "#762a83", "#9ecae1", "#fc9272")
)
## `spec_collapse = TRUE` collapses each spec block into one point; in the current mode (relation_method = 'mantel', mantel_kind = 'col_vs_col') link sources are per spec column, so all column-level links from a block will originate from the same collapsed point. Consider `relation_method = 'mantel'` + `mantel_kind = 'block_vs_col'` for a one-line-per-block visualisation.## `distance = -3` is negative; the env heatmaps will be pulled inward and may overlap the central point group. If a heatmap anchor becomes <= 0 you will get a warning and the corresponding heatmap may flip to the opposite side -- use a less negative value if that happens.## Warning: `distance = -3` is too negative for the current central layout -- at
## least one heatmap anchor became <= 0. The corresponding heatmap will flip to
## the opposite side or collapse onto the origin. Try a larger (less negative)
## `distance`.
p3[[1]]